Alex Dudov
⬤ Litecoin (LTC) is hovering around a major horizontal support level on the three-month timeframe. The chart shows a higher low compared to both the 2018 bear market bottom and the 2020 crash, with price currently near $52.86.
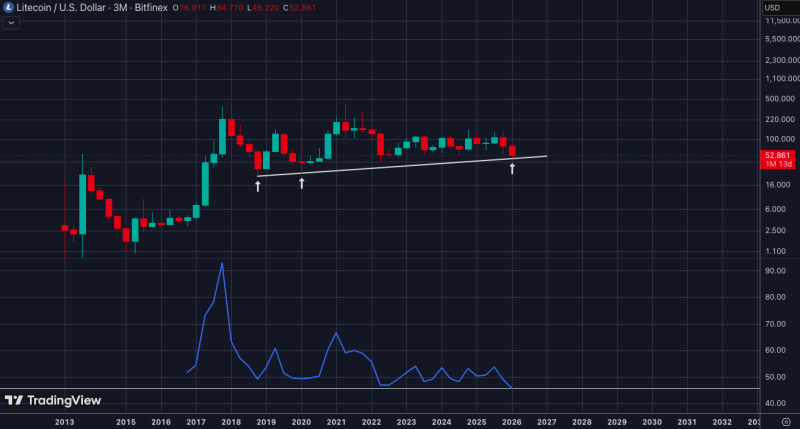
⬤ The long-term structure highlights repeated reactions around the same support zone across multiple cycles. A rising trendline connects previous lows, and the current price sits close to that area rather than breaking beneath it. Similar structural behavior was recently described in LTC Tests $53 Support Zone After Multi-Year Range Floor Revisit, where Litecoin traded near historically defended support levels.
⬤ Momentum conditions remain notable as the RSI on the three-month timeframe has reached its lowest recorded level on the chart. Despite the weak momentum reading, the price remains above prior bear market lows, maintaining a higher base relative to earlier cycles. Comparable positioning appeared in LTC Tests $45 Support at 0.786 Fibonacci Level, where Litecoin hovered inside a broader long-term support region.
⬤ The current placement of LTC near multi-year support keeps focus on whether the structure holds. A sustained hold above $52 could signal accumulation phase strength, while a breakdown would mark the first time Litecoin fails to maintain higher lows across cycles. The combination of record-low RSI and historical support creates a critical juncture for traders watching macro timeframe momentum.
 Alex Dudov