 Peter Smith

⬤ Hyperliquid's native token, HYPE, fell below a pivotal daily support near the $28.20 area, exposing downside momentum on the chart. The loss of this level on Monday signals technical weakness, with price now trading below a previously defended zone. HYPE Price Analysis: $29.6 Support Holds Inside Downtrend Channel — earlier coverage that tracked the buildup to this break. Selling activity intensified after the structure gave way, leaving lower price levels firmly in focus.
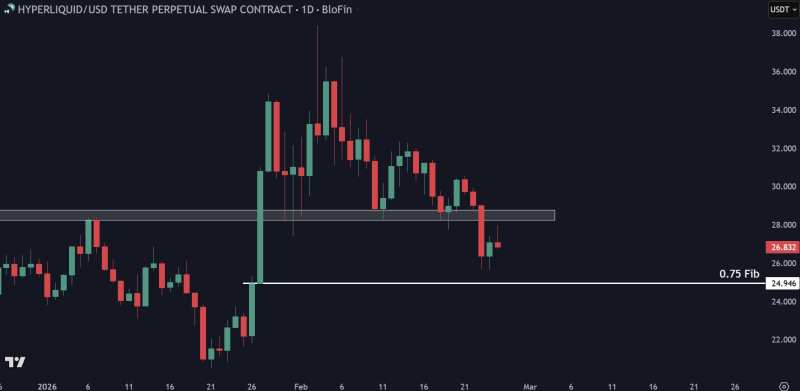
⬤ The daily chart marks the 0.75 Fibonacci retracement near $24.946 as the next logical area for downside pressure. After failing to hold above $28, HYPE slipped toward the mid-$26 range, reflecting continued selling interest around that former support. A succession of lower highs and lower lows on the daily candles underscores the bearish bias playing out on the short-term time frame.
If the $25 Fibonacci zone does not provide stable demand, additional tests lower toward the $22-$20 range remain possible.
⬤ Analysts watching HYPE technical setups note that a failure to hold the $25 zone could open the door to the $22-$20 range. HYPE Price Analysis: $38-$40 Liquidity Stack Points to $26 Sweep — prior analysis that flagged this corrective trajectory early. Price has consistently struggled to reclaim key resistance levels, a pattern that reflects weakening market internals following the loss of significant support.
⬤ The break below $28.20 has shifted the near-term outlook for HYPE toward correction rather than consolidation or recovery. The $25 Fibonacci level now serves as the key reference point, and how price behaves there will likely define short-term directional sentiment. HYPE Consolidates Near $30 as $22-$24 Demand Zone Awaits Pullback — a useful read on the demand structure that could eventually absorb further selling pressure in decentralized derivatives markets.
 Peter Smith


