 Eseandre Mordi

⬤ Ethereum is trading inside a tightening triangle near $2,150 after pulling back from the $2,300 region. As analyst More Crypto Online noted, the $2,221 level is the critical resistance to watch. A clean break above it would put weekly highs back on the radar, while a rejection keeps ETH locked in its current range.
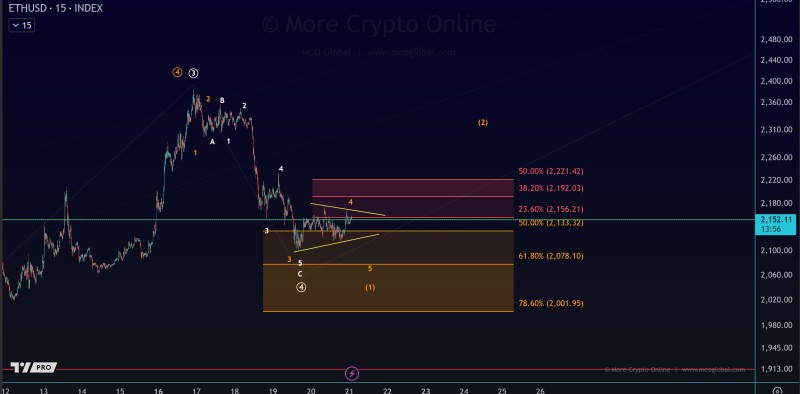
⬤ The triangle is forming with lower highs and higher lows, a textbook compression structure. Key Fibonacci resistance clusters around $2,192 and $2,221, while support sits at $2,133. Below that, downside targets extend to $2,078 and $2,001. This kind of narrowing price action historically precedes a sharp directional move, as seen when ETH Forms 4H Symmetrical Triangle as Ethereum Tests $2,600 Support.
⬤ Structurally, the triangle looks like a continuation pattern within a broader corrective phase. A breakout above $2,221 would confirm short-term bullish momentum. A failure to clear it extends the consolidation or opens another leg lower toward Fibonacci support. That dynamic mirrors what happened in Ethereum Consolidates Within Symmetrical Triangle Ahead of Big Move, where tightening ranges preceded a volatility spike.
⬤ The $2,221 mark is both a technical ceiling and a psychological trigger. A confirmed close above it shifts near-term momentum and likely increases volatility. Repeated rejection would reinforce range-bound behavior. This pattern echoes the setup covered in ETH Price Analysis: Ethereum Holds at $2,980 but Lacks Breakout Momentum, where resistance absorbed multiple tests before direction was decided.
 Eseandre Mordi


