 Usman Salis

Ethereum's price has been stuck in a holding pattern, but that might not last much longer. After weeks of quiet trading, the world's second-largest cryptocurrency is approaching a critical breakout point. The question now is whether ETH will surge higher or pull back into a correction. Technical signals suggest the calm won't last—something's about to give.
Ethereum Price Analysis: Triangle Pattern Tightens
In a recent post, Mister Crypto pointed out that Ethereum is currently trading inside a symmetrical triangle—a classic chart pattern where the price makes lower highs and higher lows, squeezing toward a single breakout point.
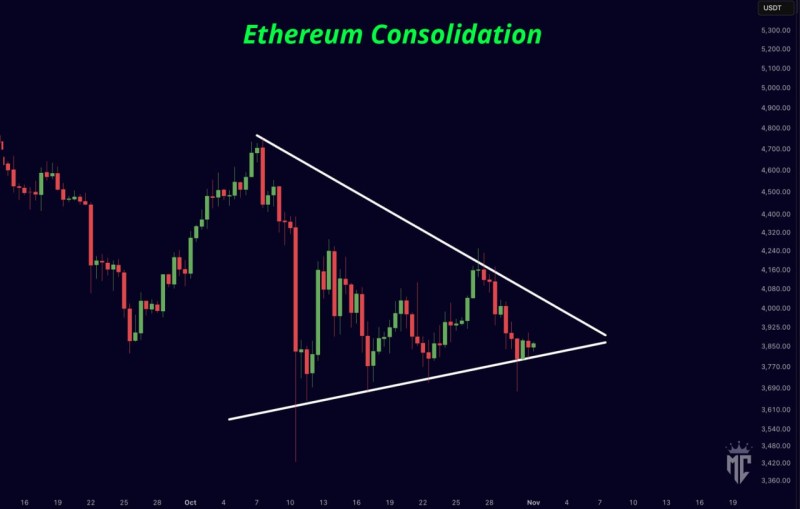
The chart shows two clear trendlines: a descending resistance line from early October and an ascending support line from mid-month. These lines are now converging around the $3,850–$3,900 zone, creating a tight range that typically precedes a sharp move in one direction.
This setup reflects market indecision, with bulls and bears in a standoff. Once the price breaks out of this range, volatility is expected to return quickly.
Key Levels to Watch
- Current support: ETH is holding above a rising trendline, keeping the short-term bias bullish as long as it stays intact.
- Resistance zone: $4,150–$4,200 marks the upper boundary of the triangle.
- Bullish breakout: A confirmed close above $4,200 could push ETH toward $4,500–$4,600, the next major resistance area.
- Bearish breakdown: A drop below $3,750 would open the door to deeper support levels around $3,600 or $3,500, invalidating the bullish setup.
Right now, the chart shows compression rather than clear direction—a classic sign that low volatility may soon flip into strong momentum.
Market Context
This consolidation phase is happening as the broader crypto market gains strength, with Bitcoin stabilizing near recent highs and altcoins showing renewed buying interest. Ethereum continues to benefit from positive sentiment around Layer-2 adoption, staking growth, and institutional interest.
Still, traders are staying cautious. Macro uncertainty and potential profit-taking could create short-term choppiness. For now, the market is waiting for Ethereum to make its move—either confirming a bullish breakout or dipping into a temporary correction before the next leg up.
Ethereum's chart suggests a major move is coming soon. The symmetrical triangle is nearing its apex, and whether the breakout goes up or down, volatility is about to return. Traders are watching closely for confirmation—and the next few sessions could set the tone for ETH's trajectory in the weeks ahead.
 Usman Salis


