Saad Ullah

⬤ Ethereum's price holds steady because ETH stays above the 4-hour 200-period moving average. The chart shows ETH near $3,150 and recent candles keep touching that average without slipping below it. This line now serves as a firm floor plus steadies the price after the wider retreat.
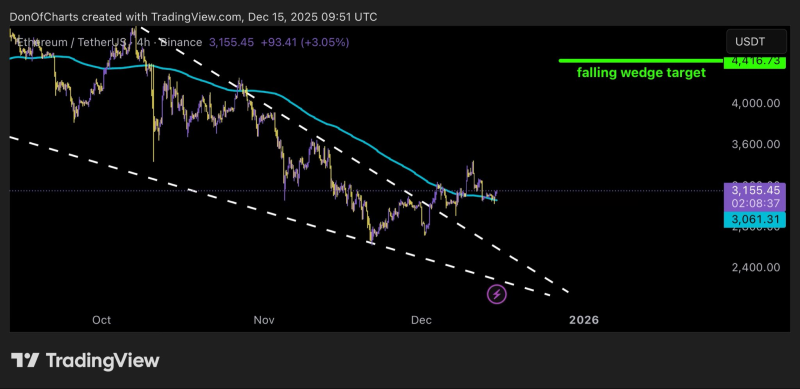
⬤ The chart shows ETH moving sideways inside a pattern that slopes downward after the drop from earlier highs. ETH has hit the 4-hour 200MA multiple times and each time it rebounds, a sign that sellers lose strength at that line. Instead of falling further, the price remains inside the present range.
The 4-hour 200MA acts as solid support but also steadies price after the broad correction.
⬤ Even with this support, ETH sits beneath major resistance - the overall picture is one of consolidation, not a definite reversal. The chart points to a possible falling wedge target near $4,416 - yet no breakout has occurred. For now price moves between the 4-hour 200MA below and the ceiling above that blocks upward steps.
⬤ This is relevant for the crypto market because Ethereum often guides general sentiment. Staying above the 4-hour 200MA halts extra declines as well as gives near term stability. While the larger trend stays uncertain holding this technical line keeps the structure whole and turns attention to whether ETH can gather strength above support in the next sessions.
 Saad Ullah