 Usman Salis

⬤ Ethereum has been holding steady above a key support area that on-chain data reveals as a major accumulation zone. The $3,119 to $2,772 range stands out on the URPD chart as the price level where massive volumes of ETH last changed hands, giving traders a clear picture of where strong buyer interest sits.
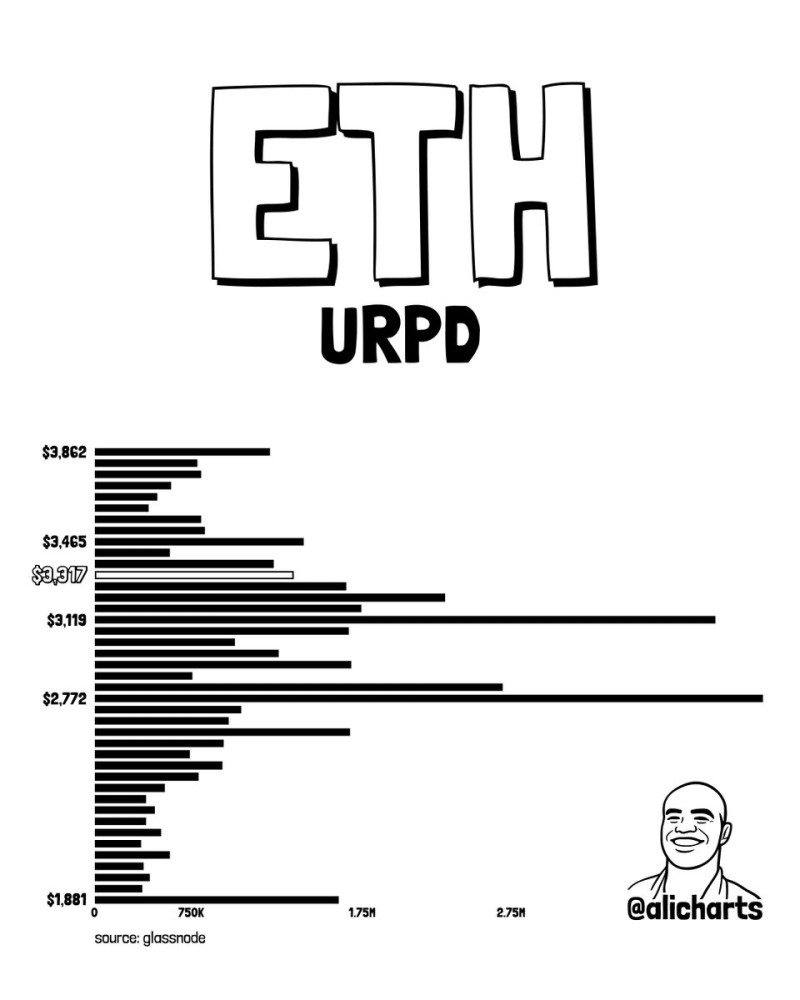
⬤ The URPD chart shows exactly where Ethereum holders bought their coins at different prices. The longest bars on the chart cluster around $3,119 and $2,772, meaning tons of people scooped up ETH in this range. These zones typically act as solid support because investors who bought there don't want to sell at a loss when the market dips.
⬤ Right now, ETH is trading above this heavy accumulation zone, which keeps the bullish structure alive. Despite some choppy price action across crypto markets lately, Ethereum hasn't dropped below this support band. The chart also reveals thinner volume above current prices, meaning there's less resistance overhead compared to the strong demand floor below.
⬤ This $3,119 to $2,772 support zone matters for the entire crypto market since Ethereum powers DeFi, layer-two solutions, and sets the tone for altcoin sentiment. If ETH keeps holding above this range, it signals the market structure is still healthy. But if price breaks decisively below it, that could mean a shift in how holders view their positions. As traders watch on-chain metrics closely, Ethereum's behavior around this zone will likely be a major focus point going forward.
 Usman Salis


