 Marina Lyubimova

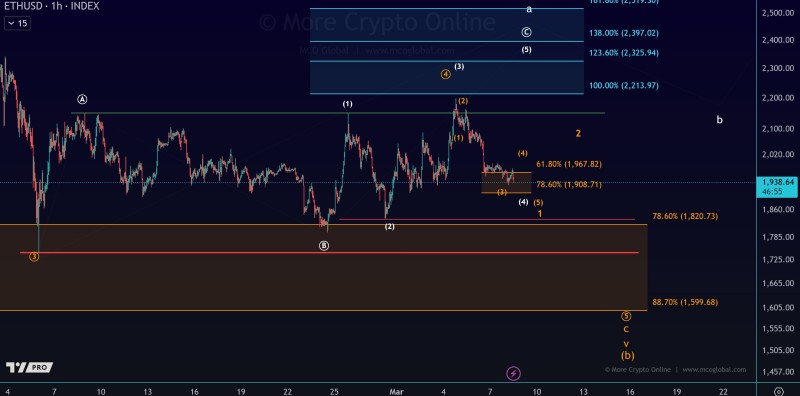
Ethereum has not been making headlines with dramatic moves lately, and that is exactly the point. After a quiet weekend drift lower, ETH is hovering around $1,938 on the hourly chart, still locked inside a consolidation structure that has resisted any clear breakout. The market is not in freefall, but it is also not showing the kind of momentum that signals a trend is forming. For now, patience and structure are doing the talking.
Fibonacci Zone Between $1,908 and $1,967 Is the Key Area to Watch
The chart highlights a Fibonacci retracement zone stretching from roughly $1,967 down to $1,908, corresponding to the 61.8% and 78.6% levels. These are the levels traders watch closely when a trend-following setup could either reset or break down entirely. Ethereum has slipped into this zone following a pullback from resistance tested earlier in March. Whether price stabilizes here or continues to compress will likely shape the next meaningful move.
As covered in Ethereum Eyes $1,920-$1,930 Support Zone After Recent Pullback, ETH had already been approaching this cluster of technical support after failing to hold higher. The current price action fits that same narrative, with buyers and sellers both waiting for confirmation before committing.
Wave Structure Points to Possible Rebound, but Downside Risk Remains
The wave count on the chart places price inside a corrective white wave (4), and the current pullback has gone slightly deeper than initially expected for that scenario. A bounce from this zone is still plausible, but the quality of that bounce matters. If the recovery turns out to be weak and choppy rather than sharp and impulsive, the structure could shift toward a 1-2 setup, which would open the door to further downside.
This dynamic was explored in Ethereum Price Analysis: Critical Support Zones That Could Make or Break ETH, where the same technical levels were described as pivotal for determining whether a deeper correction develops or bulls manage to defend key ground. Ethereum has a history of grinding through extended sideways phases before picking a direction, and nothing in the current structure rules that out.
Looking at the bigger picture, Ethereum Shakeout Signals a Possible Q4 Breakout highlighted how temporary drops within ranging conditions can sometimes serve as liquidity sweeps before a larger directional move. Until Ethereum shows a decisive break above resistance or loses this Fibonacci support zone convincingly, the range remains intact and the wait continues.
 Marina Lyubimova


