Saad Ullah

Ethereum is holding inside a key resistance band after weeks of consistent rejection at Fibonacci levels. Unlike previous rally attempts that were swiftly turned away, the current price action shows ETH sustaining within this zone - raising the possibility that the prior rejection pattern may be weakening.
Crypto analyst Sky flagged this development, noting that ETH's behavior inside the current Fibonacci cluster looks different from what preceded it - a distinction that matters for short-term trend structure.
The Fibonacci Rejection Pattern That Defined ETH's Downtrend
Recent ETH price action on the 4-hour chart has been shaped by repeated failures at Fibonacci retracement levels. Each rally attempt into resistance zones ended in rejection, reinforcing a broader corrective structure.
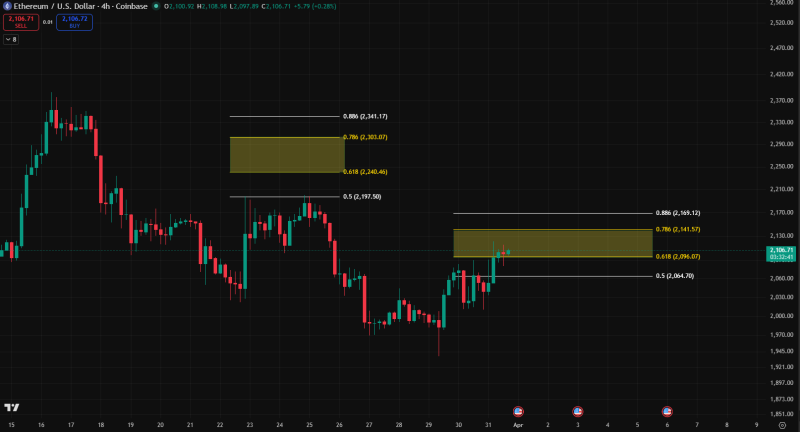
A higher Fibonacci zone near the 0.618-0.786 range - around $2,240-$2,300 - acted as a clear ceiling earlier in the chart. Price entered that area but was quickly forced lower, continuing the sequence of lower highs.
Resistance held firmly at every test, and upside attempts consistently lacked follow-through.
This established a predictable behavior that defined the downtrend: sellers dominated at known Fibonacci levels, and bulls could not hold any ground inside resistance.
ETH Consolidates Inside the $2,096-$2,141 Zone Without Sharp Reversal
The current move is testing a lower Fibonacci cluster between approximately $2,096 (0.618) and $2,141 (0.786). Instead of an immediate sharp rejection, ETH is consolidating within this range - something not seen at previous resistance tests.
This may indicate a break from the previous pattern of immediate rejection at Fibonacci levels.
That distinction is critical. Markets often signal change not through explosive breakouts, but through how price behaves at known resistance. Holding inside the zone suggests sellers are no longer in full control.
Where the Pressure Begins to Shift
While ETH has not confirmed a breakout, the structure is evolving across several observable signals:
- Price is no longer making aggressive lower highs
- Consolidation is forming directly within resistance
- Selling pressure appears less immediate compared to prior tests
The upper boundary near $2,140 remains the key barrier. A sustained move above it would open the path toward the 0.886 level around $2,169, marked on the chart as the next resistance.
The 61.8%-78.6% Fibonacci zone continues to act as the decisive area for either rejection or breakout - and right now, ETH is sitting inside it without collapsing.
This aligns with broader Ethereum technical analysis, where the 61.8%-78.6% band consistently serves as a pivot between continuation and recovery.
The ETH Fibonacci Signal Traders Are Watching Now
Ethereum is no longer reacting to resistance the same way it did earlier in the trend. That change alone is what makes the current setup notable for traders monitoring Ethereum's medium-term wave targets.
If ETH continues to hold within this Fibonacci band, it would mark the first clear deviation from the established rejection pattern. In technical terms, that increases the probability of a transition away from the corrective phase.
At the same time, failure here would reinforce the existing structure - one where Fibonacci resistance continues to cap upside and define price direction.
For now, ETH sits at a key inflection point. The reaction inside this zone - not just the breakout itself - is what will determine whether the market is beginning to shift or simply repeating the same pattern once again.
 Saad Ullah