 Usman Salis

⬤ Ethereum's been catching traders' attention lately thanks to a textbook head and shoulders pattern showing up on the 4-hour timeframe. The setup is pretty clear—there's a left shoulder, a higher peak forming the head, and now a right shoulder taking shape. This type of formation usually pops up when an uptrend is running out of steam, and technical analysts are watching it closely as a potential signal for a drop toward the $2,400 area.
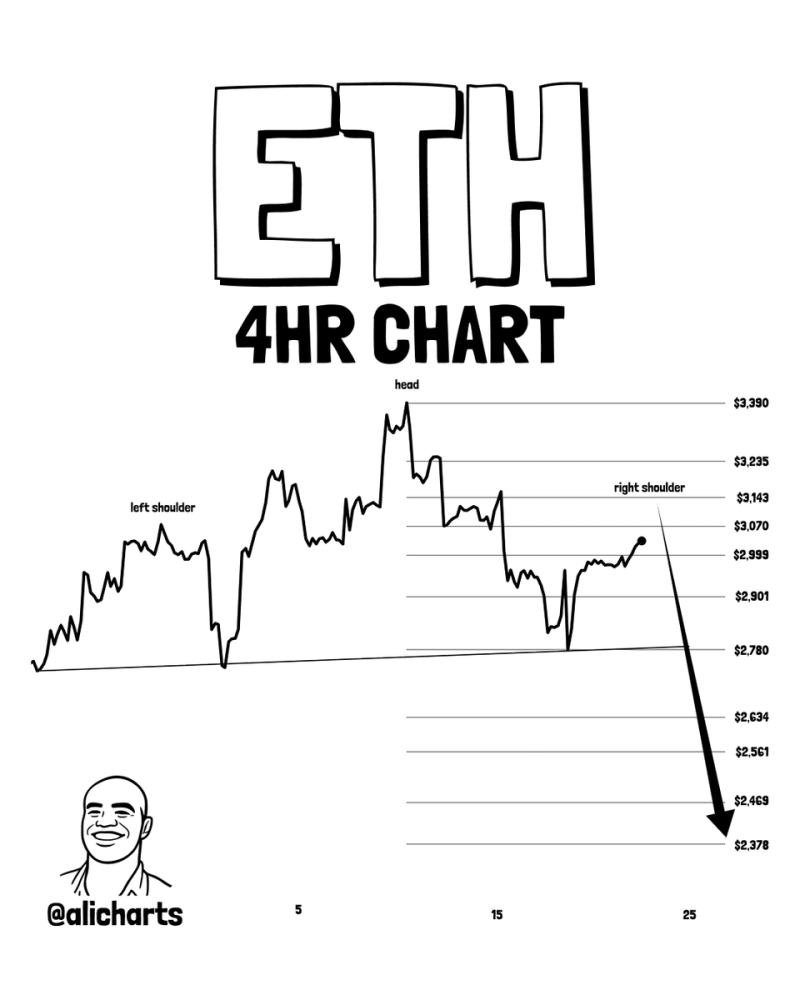
⬤ The chart lays out some key price zones that bring this pattern into focus. The head sits near $3,390, while the right shoulder is developing below roughly $3,150. Multiple support levels are stacked around $2,780, $2,634, and $2,561, with the projected move pointing down toward approximately $2,378. That lines up nicely with the $2,400 target and follows the typical measured move you'd expect from this kind of pattern.
⬤ Recent price movement shows ETH losing some upward push after hitting that head peak, with lower highs starting to form as the right shoulder develops. The neckline sitting around $2,780 is the make-or-break level here. If price decisively breaks below that zone, the pattern confirms and the path opens up toward the downside target. Until that happens, though, it's still just a developing structure on the charts rather than a confirmed directional move.
⬤ This matters for the broader crypto market because Ethereum tends to set the tone for overall sentiment. A confirmed drop toward $2,400 could drag on short-term momentum across the altcoin space, while holding above support would kill the pattern and suggest renewed bullish energy. Either way, this head and shoulders setup gives traders a clear technical roadmap for gauging near-term risk in ETH and the wider digital asset market.
 Usman Salis


