 Usman Salis

⬤ ETH is flashing some warning signs after forming a three-wave move higher on the 30-minute chart. The price bounced back from lower levels but keeps getting rejected below descending resistance. This structure looks like a high B-wave, which typically means we're more likely to see renewed downside pressure rather than a sustained breakout.
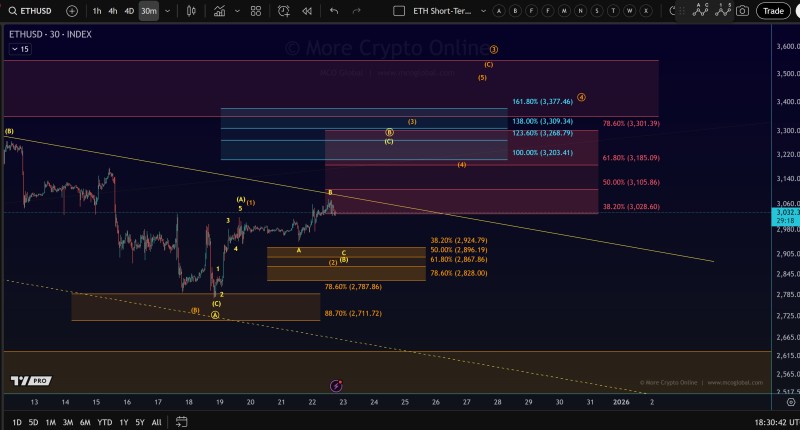
⬤ The chart shows ETH climbing from the lower $2,800 region up toward the $3,030-$3,060 area before running out of steam. The move unfolded in three distinct waves—a pattern traders often associate with corrective price action rather than a genuine trend reversal. ETH is still trading below that downward sloping trendline, suggesting the recent bounce hasn't changed the short-term bearish structure yet.
⬤ Multiple Fibonacci levels on the chart map out key zones to watch. Resistance is stacked up between roughly $3,100 and $3,300, while the micro support zone sits clearly defined around $2,800-$2,900. That support zone hasn't budged, which reinforces the possibility of a retest if sellers step back in after this corrective bounce.
⬤ Why does this matter? ETH often sets the tone for short-term direction across the broader crypto market. Another test of support could keep cautious sentiment alive and extend the current consolidation phase. On the flip side, if ETH manages to hold that micro support zone, it would help stabilize price action and keep the range intact while the market figures out its next move.
 Usman Salis


