Alex Dudov

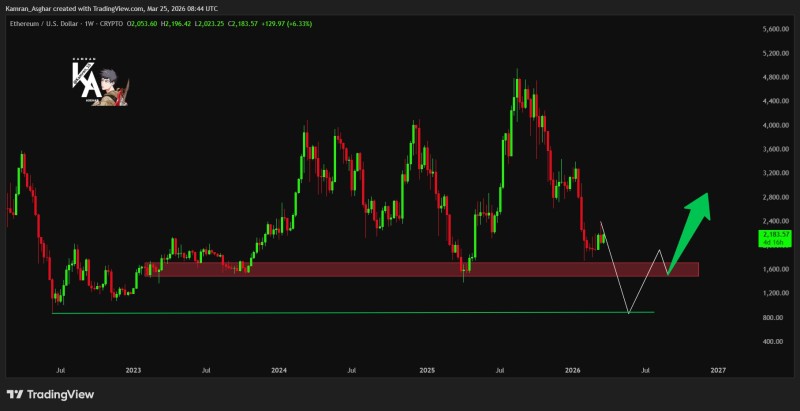
Ethereum has dropped sharply from highs above $4,800, and the weekly chart now places ETH close to one of the most significant demand zones in its recent history. Trading near $2,100, the asset is entering territory where high-timeframe structure tends to define major turning points. The current setup points to a possible liquidity sweep below the $1,500-$1,700 range before any meaningful recovery takes shape.
ETH Approaches the $1,500-$1,700 High-Timeframe Demand Zone
The weekly chart shows ETH trending lower toward a demand zone between $1,500 and $1,700, where price previously consolidated before a strong upward expansion. According to analysis by Kamran Asghar, this zone could serve as a key reaction point in the broader market structure. Historical behavior at similar levels suggests that a brief dip below support to collect liquidity often precedes a directional reversal, a pattern documented inETH Holds $3,100 Support but Risks Sweep Below $3,000.
Repeating Cycle: How ETH Behaves Near Structural Support
Ethereum has a track record of reacting strongly from high-timeframe demand zones after extended pullbacks. The $2,100-$2,400 area was already flagged as critical inETH Tests Critical $2.1K-$2.4K Support as Weakness Shows, where price entered a decisive support region following the decline. Further context from Ethereum Price Holds $2,000 Support as Bull Cycle Roadmap Shows Key Accumulation Zoneconfirms that such zones have historically acted as accumulation areas before larger moves.
The broader structure reflects a repeating cycle of expansion and correction. With ETH now nearing the $1,500-$1,700 demand zone, the setup highlights a potential inflection point. If demand holds at this level, price action could transition from the current corrective phase into a new directional move. How the market behaves around this zone in the coming weeks will likely determine whether Ethereum enters a fresh accumulation phase or faces further downside pressure.
 Alex Dudov