 Marina Lyubimova

⬤ ETH just hit a make-or-break zone. Recent selling pressure dragged price straight into the $2.1K–$2.4K range—a massive weekly demand area that's held before. The weekly chart shows Ethereum struggling to find its footing after getting rejected from higher levels.
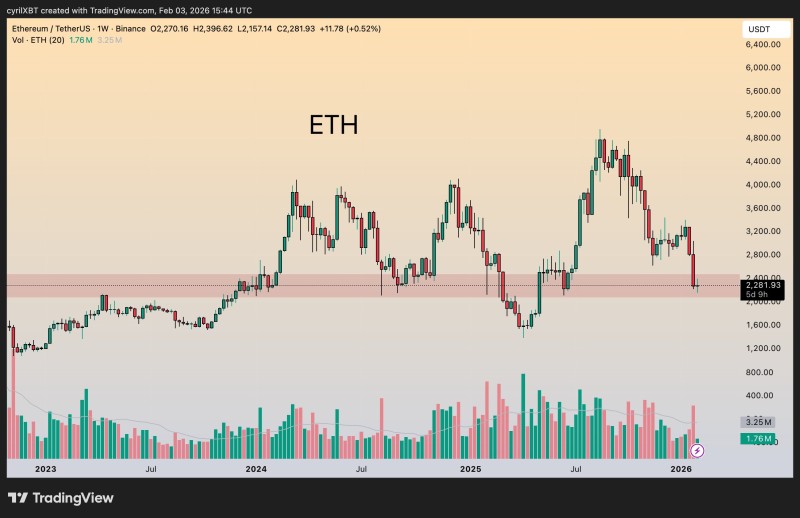
⬤ This price band has been tested multiple times, and each interaction shows just how critical it is for ETH's structure. After trading north of $4,000 during the last rally, Ethereum entered a brutal correction that's now landed right on this support. Market activity here looks hesitant—bulls and bears both waiting to see who blinks first.
⬤ Here's what's at stake: if the $2.1K–$2.4K zone holds, ETH could catch a bounce from current levels. But if this support cracks? The chart points to $1.6K–$1.8K as the next stop. Ethereum's in a fragile spot, and whether buyers show up here or sellers break through will determine what happens next.
⬤ This isn't just about ETH—what happens at this level could set the tone for the entire crypto market. Holding above this demand shows strength after months of pain. Breaking below it? That opens the floodgates for more downside across digital assets. How Ethereum handles this weekly support will likely shape volatility and direction in the near term.
 Marina Lyubimova


