 Usman Salis

⬤ Ethereum is currently sitting in the $2,000 to $2,400 range, right where long-term cycle analysis suggests major accumulation happens. Looking at price behavior dating back to 2018, this zone has repeatedly served as a re-entry point before the next leg up. The chart framework shows why so many traders miss these opportunities—they wait for confirmation at higher prices instead of buying during quiet consolidation phases.
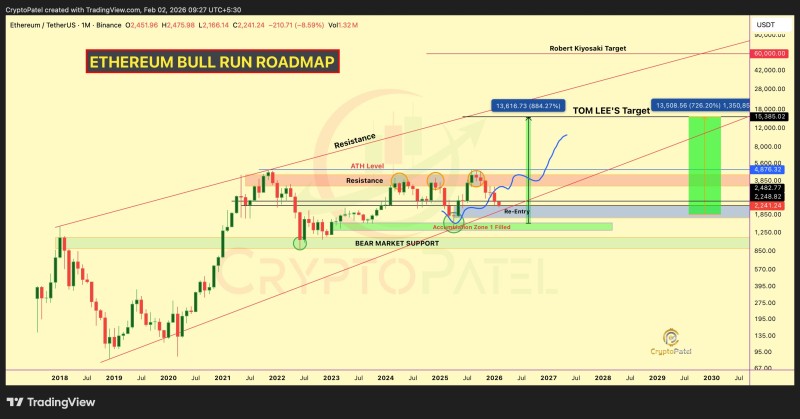
⬤ Historical patterns reveal a consistent rhythm: ETH pushes into resistance near previous peaks, pulls back to long-term support, then spends time moving sideways. These consolidation periods sit above bear market lows but well below cycle highs, creating the exact accumulation windows we're seeing now. The current zone fits this profile perfectly after the recent pullback from elevated levels.
⬤ The roadmap extends beyond today's action, mapping upward channels and resistance bands into the coming years. Earlier accumulation zones on the chart eventually gave way to significant rallies within rising trend structures. While these projections outline potential scenarios rather than guarantees, they highlight how price tends to revisit lower demand areas before building momentum for the next move.
⬤ Ethereum's position matters for the entire crypto market since it often sets the tone for broader cycle timing and sentiment. When ETH consolidates at historically meaningful levels, it shapes how traders think about risk and positioning across digital assets. Right now, with price sitting in a zone that's previously marked accumulation phases, the market is watching to see if this cycle follows the same playbook as the ones before it.
 Usman Salis


