 Marina Lyubimova

⬤ Ethereum is trading near a critical support zone after tapping $3,100 and bouncing. The chart shows ETH stuck in a broader downtrend with multiple failed attempts to break above overhead resistance. Several red resistance zones between roughly $3,250 and $3,700 mark key barriers that Ethereum hasn't been able to reclaim since the recent breakdown.
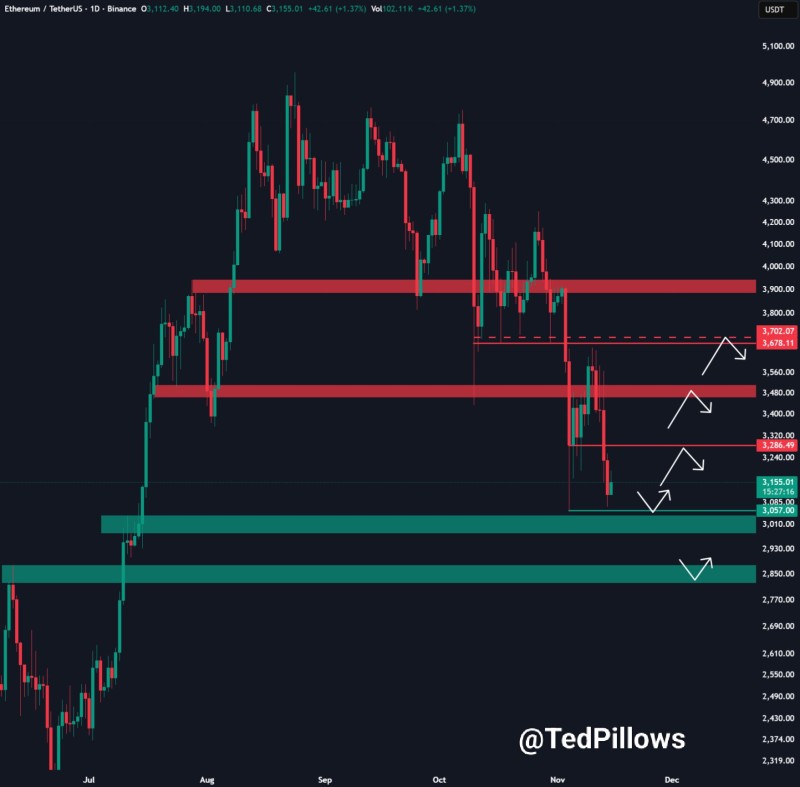
⬤ If weakness continues, ETH may sweep liquidity below the $3,000 level—a move reflected by downward arrows on the chart pointing toward lower support. As of now, ETH is trading near $3,155, hovering just above this crucial threshold.
⬤ Below $3,000, there's a broad green demand zone around $2,850–$2,900 that previously acted as structural support. If Ethereum dips below the round number, this zone could be where price tries to stabilize. The chart also shows upward arrows marking potential rebound areas, suggesting a recovery might follow once liquidity gets collected below $3,000.
⬤ This setup matters because Ethereum often sets the tone for broader market sentiment. A sweep below $3,000 followed by a bounce could mark a local bottom and set the stage for a relief rally—if buyers actually show up.
 Marina Lyubimova


