 Alex Dudov

⬤Ethereum (ETH/USD) has been trading inside a prolonged consolidation structure visible on the long-term chart. Price keeps testing a horizontal resistance zone near previous cycle highs while forming higher lows along a gradually rising support trendline - a broad channel that has contained moves since the 2020-2021 rally.
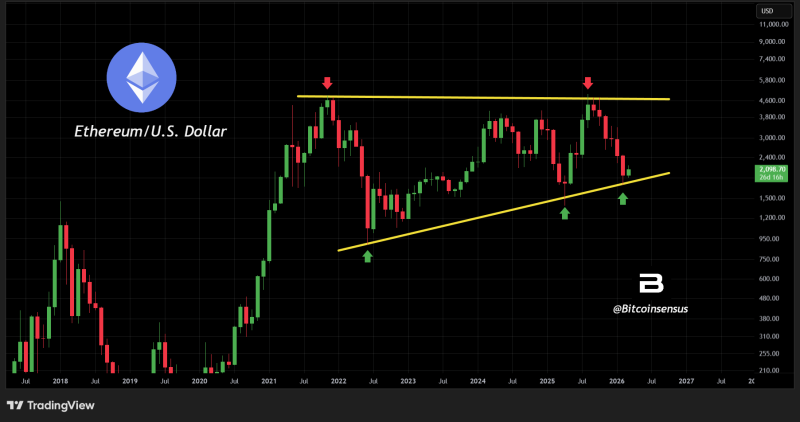
⬤The chart shows two major peaks near the upper boundary of the range, both rejected close to the same resistance band. These repeated reactions show how ETH has struggled to hold momentum above that ceiling, even as buyers keep defending pullbacks near rising support. More detail on this setup appears in Ethereum Near 5-Year Range With $5K Breakout in Focus, which tracks ETH within a multi-year structure ahead of a potential breakout.
⬤Ethereum is gradually compressing between ascending support and a horizontal resistance ceiling. Multiple higher lows signal persistent demand during retracements, while the resistance zone caps upward moves - classic accumulation dynamics. A related take is covered in Ethereum Near 200WMA as 5-Year Accumulation Zone Persists, where ETH was described as sitting inside a multi-year range supported by rising trendlines.
⬤Extended consolidation patterns like this one can become key reference points for market sentiment. Long ranging periods often precede strong directional moves once price breaks out of the boundaries. Ethereum Price Analysis: Bulls Eye Explosive Rally Toward $5,000 also flags consolidation structures as a possible foundation for expansion once resistance gets decisively broken.
⬤As ETH continues to fluctuate between support and resistance, the channel remains the key structural framework for reading price action. Whether the market stays inside the range or breaks above resistance will likely define the next major phase in Ethereum's long-term trajectory.
 Alex Dudov


