 Saad Ullah

⬤ Dogecoin is testing a crucial technical zone on the daily chart, with DOGE trading around $0.128 after breaking below a long-term ascending trendline. This trendline had supported price action since early 2024, providing a structural foundation for multiple bounces. The breakdown from this multi-year support puts Dogecoin at a pivotal moment for short-term direction.
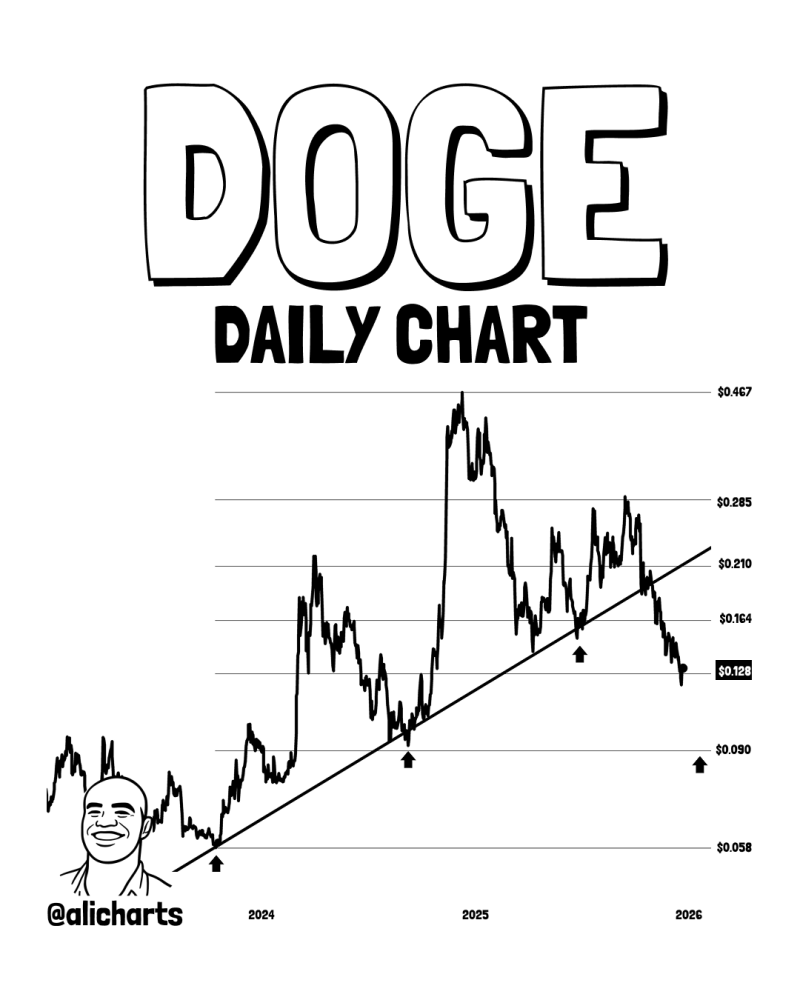
⬤ The chart shows DOGE respected the rising trendline through several pullbacks, bouncing near $0.058 and later around $0.090. After rallying to a peak near $0.467 in 2025, the price shifted into a correction with lower highs and increased volatility. The break below the trendline changed the overall structure, sending DOGE down to the $0.128 area—now the nearest horizontal support.
⬤ Former support zones near $0.164 and $0.210 now sit above current price and appear to be acting as resistance. Below the market, the next clear support sits near $0.090, a level tied to earlier consolidation and previous buying interest. The chart indicates relatively thin structural support between $0.128 and $0.090, making the current range technically significant.
⬤ This price action matters for the broader crypto market since Dogecoin remains a highly liquid, sentiment-driven asset. Breakdowns from long-term trendlines often signal shifts in market psychology and volatility. How DOGE performs around $0.128 could influence near-term sentiment and determine whether the price stabilizes or continues falling toward lower support levels.
 Saad Ullah


