 Marina Lyubimova

⬤DOGE price momentum is drawing attention after technical indicators on the monthly chart reached historically low levels. The RSI has moved toward the lower boundary around the 40 level, a zone that analyst historically coincided with the end of downward momentum. Traders watching DOGE's return to the $0.10 support zone note this long-term structure previously preceded major rallies.
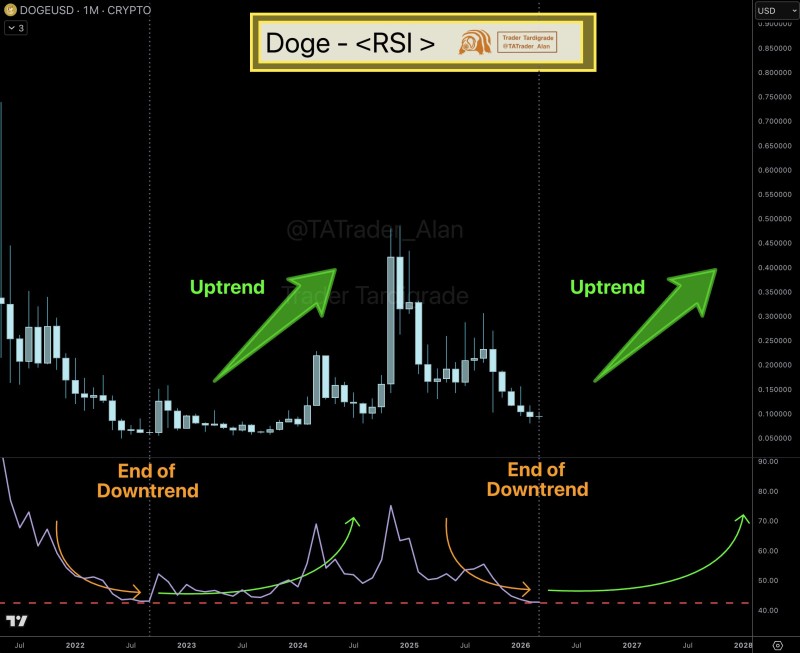
⬤Looking back at previous market cycles, each time DOGE entered a bearish phase and the RSI approached its lower range, selling pressure eased before the asset transitioned into a new uptrend. The chart marks these moments as "End of Downtrend," with arrows pointing to renewed bullish phases. This recurring structure suggests the current RSI zone has repeatedly served as a turning point for market momentum.
⬤The RSI is now at one of its lowest monthly readings and beginning to flatten, which may indicate weakening selling pressure. Analysis in Dogecoin Price Analysis: RSI Pattern Suggests Move Toward $0.21 explains how an upward RSI curve at this stage could signal the end of the downtrend and the start of a recovery phase. Momentum indicators are widely used in technical analysis to detect exactly these kinds of bearish-to-bullish transitions.
⬤The technical structure places DOGE at an important stage within its longer market cycle. While broader crypto conditions still influence price behavior, the current RSI configuration suggests a potential trend shift after the extended decline. Additional analysis in Dogecoin Price Analysis: Path Toward $1 points to historical chart patterns that could support a renewed bullish phase if technical conditions continue improving.
 Marina Lyubimova


