 Saad Ullah

Dogecoin might be gearing up for one of its biggest moves in years. The weekly chart shows DOGE trapped inside a huge symmetrical triangle—a classic pattern that tends to explode once price reaches the pointy end. Right now, DOGE is sitting right on the lower support line, and traders are watching closely to see if history repeats itself with another sharp bounce.
What the Chart Is Telling Us
According to NekoZ, DOGE is at a textbook bounce zone.
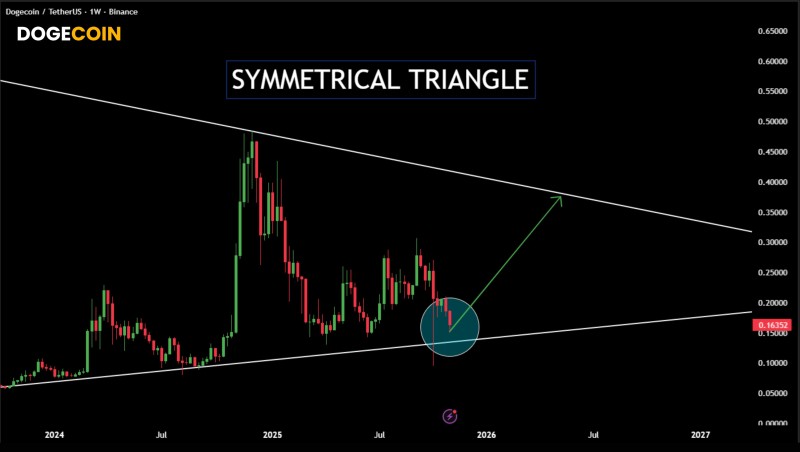
The symmetrical triangle has been forming since early 2024, with price squeezing tighter and tighter between lower highs and higher lows. Here's what matters most:
- Lower trendline test: DOGE is sitting directly on the ascending support line—a level that's triggered sharp bounces before
- Upper breakout target: The top of the triangle sits around $0.30–$0.35, and a weekly close above that could confirm a breakout
- Volatility is building: As DOGE nears the apex of the pattern, expect compression to give way to a decisive move—either up or down
- Bullish structure intact: Despite recent pullbacks, the overall setup stays valid as long as that lower trendline holds
Why This Could Be Important
Dogecoin's setup comes at a time when the broader crypto market is looking for catalysts—potential rate cuts, improving liquidity, and a fresh wave of retail interest. DOGE tends to shine during periods of rising risk appetite, especially when Bitcoin and Ethereum are pushing higher. If those conditions align, DOGE could see amplified volatility to the upside.
 Saad Ullah


