 Saad Ullah

⬤ Dogecoin has caught traders' attention as its price action forms another wedge pattern on the weekly chart. The cryptocurrency has been trading within an increasingly narrow range, with a tightening formation that typically precedes a significant price movement in either direction.
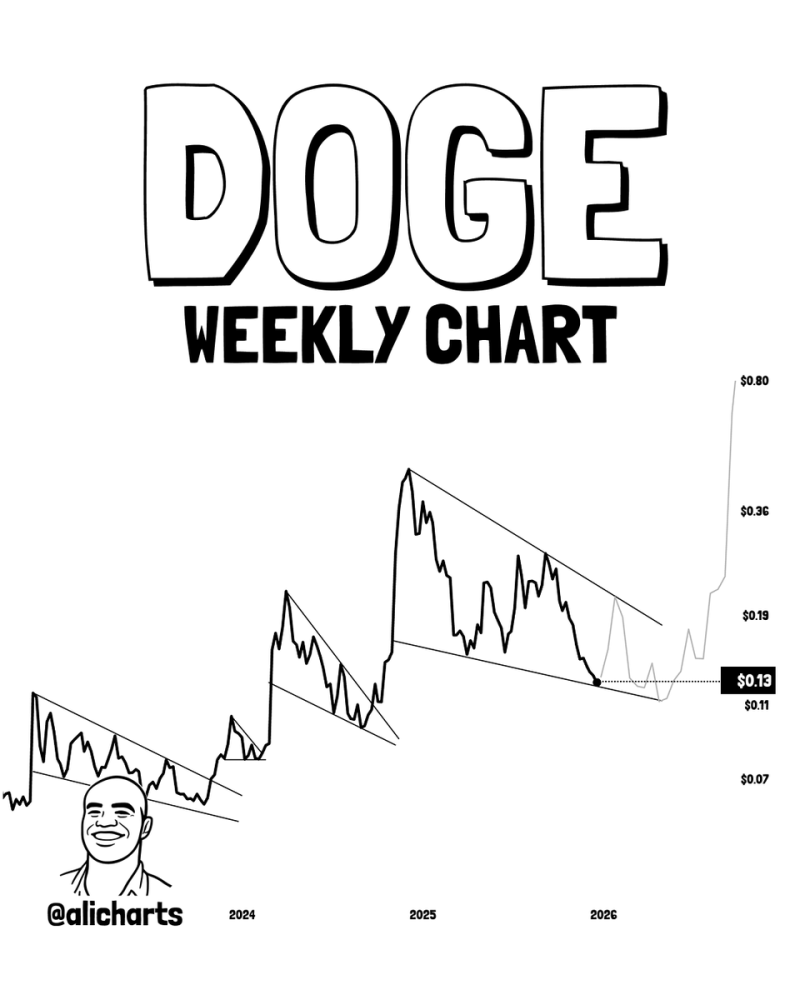
⬤ The weekly chart reveals a classic wedge structure with higher lows and lower highs converging. Resistance sits near $0.36, while crucial support holds around $0.13. These two levels will determine whether Dogecoin pushes higher or faces downward pressure in the coming weeks.
⬤ If the price breaks above $0.36, bulls could drive Dogecoin toward higher targets. However, dropping below $0.13 would likely trigger additional selling pressure, potentially sending the price down to the wedge's lower boundary. Market participants are monitoring both levels carefully as the pattern matures.
⬤ This setup matters because wedge patterns often lead to sharp moves once resolved. A breakout would confirm bullish momentum, while a breakdown could shift the trend bearish. Given Dogecoin's influence on broader crypto sentiment, this technical moment carries weight beyond just DOGE traders.
 Saad Ullah


