 Saad Ullah

⬤ Dogecoin (DOGE/USD) just broke above a critical trendline on the two-week chart, marking a significant technical shift. The current price pattern looks remarkably similar to what happened during the 2014–2017 cycle—another period that kicked off with a trendline breakout. Charts comparing both periods show the same kind of trend formation playing out right now.
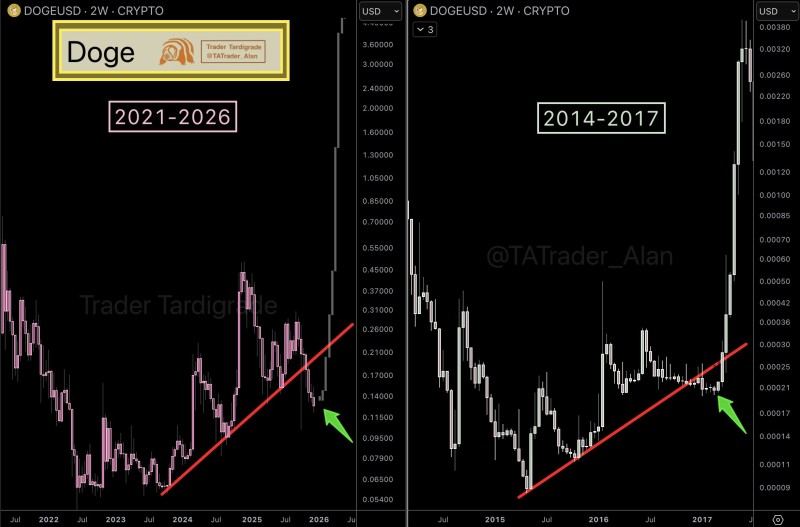
⬤ Both cycles share a common story: Dogecoin spent years building a base below a rising trendline before finally pushing higher. Back in 2014–2017, DOGE moved from a long consolidation phase into a major uptrend after breaking that line. Today's setup follows the same playbook, with price now trading above what had been a controlling trendline for years.
⬤ Using the two-week timeframe matters here—it shows this is about structure, not just short-term noise. The breakout comes after a lengthy correction from the 2021 peak, suggesting the market might be entering a new phase. While there are no specific price targets being called, the trendline break serves as an important reference point for understanding where Dogecoin might be headed.
⬤ This development carries weight beyond just DOGE itself. As one of crypto's most-watched assets, Dogecoin often reflects broader shifts in market sentiment, especially within high-risk and meme coins. A confirmed trendline break on higher timeframes can reshape market narratives and influence how traders view the space. Whether or not history repeats exactly, this chart reinforces how long-term technical patterns shape what people expect from the market.
 Saad Ullah


