 Alex Dudov

⬤ Dogecoin (DOGE) has dropped on the monthly chart, bringing the price closer to two important support zones at $0.10 and $0.062. The current monthly candle shows DOGE hovering around $0.14 after pulling back from recent peaks.
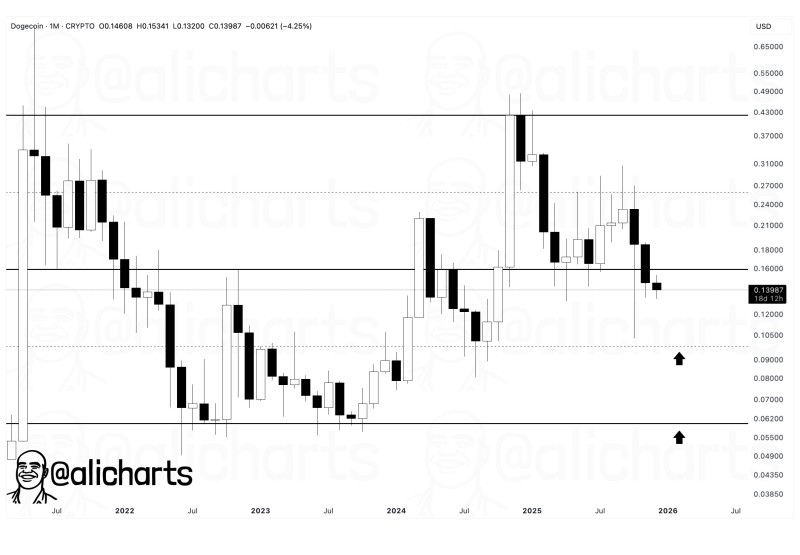
⬤ The chart reveals Dogecoin's long-term price structure with several horizontal levels that previously acted as resistance and support across different market cycles. The $0.16 area, which previously capped rallies, has now been broken, shifting attention to lower demand zones. Price action around this level points to consolidation rather than a clear directional move.
⬤ The $0.10 zone stands out as a historically significant area where Dogecoin found stability during past corrections. A deeper support region sits near $0.062, matching prior consolidation ranges and reaction lows from earlier market phases. These levels represent potential areas where price might pause or find footing.
⬤ This technical picture matters for the broader crypto market, as Dogecoin often mirrors sentiment shifts among speculative digital assets. The well-defined support zones on the monthly chart provide clear reference points for tracking longer-term market structure. How price reacts around these levels could shape near-term sentiment across meme coins and related crypto segments.
 Alex Dudov


