 Marina Lyubimova

⬤ Dogecoin (DOGE) is trading at a make-or-break technical level as price bounces strongly from a major demand zone on the daily chart. DOGE has been stuck in a bearish daily trend, but buyers have shown up around the $0.13 to $0.15 range, where the token is currently seeing a noticeable reaction. The chart shows repeated support within this zone, making it crucial to watch whether DOGE can keep closing above this area.
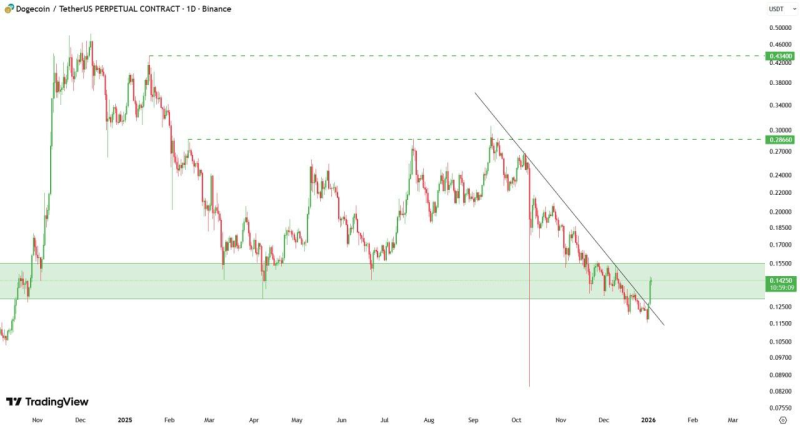
⬤ The $0.13 to $0.15 zone is now the key support level where buyers are actively defending the price. DOGE has bounced from this range, and as long as it holds above it on a daily close, a relief move toward $0.17 to $0.20 remains on the table. This looks more like a potential bounce than a full reversal, with the broader daily structure still showing downward pressure. The chart also reveals a declining resistance trendline that DOGE recently tested during its recovery attempt.
⬤ The risk? A daily close below $0.13 would signal a structural breakdown for DOGE, potentially triggering further bearish momentum and lower prices. That makes this trading range a critical decision point, with traders watching closely to see if support can hold. The price action shows volatility is still running high as the market debates whether this recent strength has legs.
 Marina Lyubimova


