 Marina Lyubimova

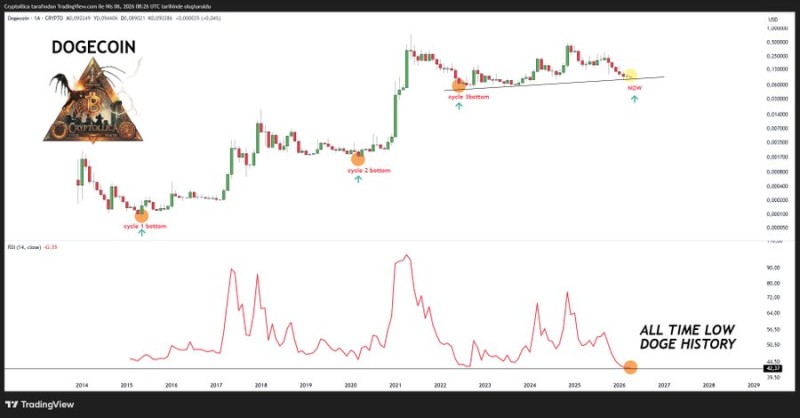
Crypto analyst Hailey LUNC XRP flagged a rare development on Dogecoin's long-term chart: the monthly RSI has fallen to an all-time low, a condition that puts DOGE in the same momentum territory that preceded some of its most significant cycle shifts. The reading is not just low - it is lower than anything recorded in the asset's history.
The monthly RSI has reached its lowest level ever recorded for DOGE, placing the asset in extreme oversold territory.
DOGE Monthly RSI Drops to Unprecedented Levels
What makes this signal stand out is the timeframe. Monthly RSI extremes develop slowly and carry more weight than shorter-term indicators because they reflect sustained, long-term shifts in momentum rather than day-to-day noise. The current reading suggests that selling pressure has been compressing DOGE's momentum to a degree never seen before on this timeframe.
DOGE Nears 30 Weekly RSI as Dogecoin Tests Historical Breakdown Pattern confirms that momentum compression across multiple timeframes has been a recurring theme for DOGE in recent months, with each compression phase eventually resolving into a directional move.
Such readings are rare on higher timeframes. Long-term RSI extremes typically appear during late-stage declines, when downside momentum becomes stretched beyond normal bounds.
What the Dogecoin Chart Structure Actually Shows
The chart identifies several historical cycle bottoms, each forming after extended periods of decline. The current setup is categorized similarly, suggesting DOGE may be entering another long-term low phase. Importantly, the chart does not confirm a reversal - it confirms that price is stabilizing after a prolonged downtrend while momentum remains at historically depressed levels.
Dogecoin RSI Hits Historic Low Near 40, Reversal Signal Emerges documents a comparable setup from an earlier period, where low RSI on longer timeframes corresponded with an extended consolidation phase before any meaningful price recovery developed.
Why an Oversold DOGE RSI Does Not Mean Instant Recovery
This is the part many traders misread. An oversold reading reflects exhaustion in selling pressure - it does not trigger an automatic reversal. The current setup shows:
- Momentum at historical lows
- Price consolidating after a prolonged decline
- No confirmed breakout structure yet
DOGE has demonstrated in previous cycles that it can hold in low-momentum zones for extended periods before resolving in either direction. The signal marks a phase, not a price target.
Historically, such extremes have marked some of the most important phases in Dogecoin's market cycle - not as timing tools, but as positioning signals within the broader cycle structure.
Dogecoin Retests Historic Channel for the 3rd Time, $3 Target in Sight offers additional structural context, showing how DOGE's long-term channel behavior has repeatedly defined the boundaries of its major price phases.
The Cycle Signal Traders Are Watching on DOGE
The core takeaway from this chart is not about timing a trade - it is about recognizing where DOGE sits within its broader market cycle. Every previous instance of extreme monthly RSI compression on this chart aligned with what turned out to be a significant low phase. Whether the current moment follows the same pattern depends on how price behaves in the weeks ahead.
For now, one condition defines Dogecoin's technical picture: extreme oversold momentum on the monthly timeframe, at a level the asset has never reached before.
 Marina Lyubimova


