 Peter Smith

⬤ Dogecoin keeps trading around $0.139, sitting comfortably near the lower edge of its multi-month range. A swing long position stays active as the daily chart shows the coin holding ground at a level that's worked as support all year. The price action suggests buyers are showing up whenever DOGE tests this zone.
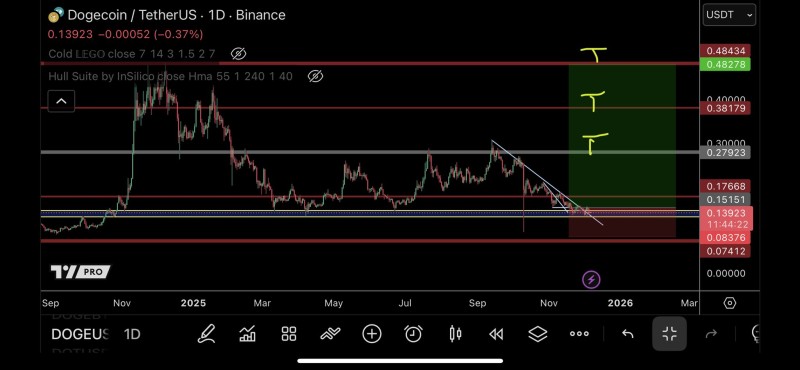
⬤ The chart shows DOGE just broke through a descending trendline, hinting at a possible momentum shift. Five resistance zones line up ahead—starting at $0.151, then $0.176, with bigger walls at $0.279 and $0.381, and a final target sitting near $0.482. These aren't random numbers—they're spots where Dogecoin ran into heavy action before. Most of 2025 has seen DOGE bouncing inside this wide horizontal pattern.
⬤ A green target zone on the chart maps out where this swing move could head next. Dogecoin tends to squeeze for long stretches before making sharp moves, and breaking that trendline opens the door to rotation toward those resistance bands. But here's the thing—price is still inside that multi-month pattern, so breaking through the first resistance cluster will matter more than anything else right now.
⬤ The fact that DOGE keeps stabilizing here says something about demand at the lower end. This zone matters because when Dogecoin moves, other meme coins usually follow. If price starts climbing toward those upper levels, it'll tell us a lot about where this cycle might be headed and whether bulls can push through historically tough zones.
 Peter Smith


