 Saad Ullah

⬤ Dogecoin is catching technical traders' eyes as a possible diamond continuation pattern takes shape on the 8-hour chart. The price action shows DOGE compressing into a distinctive diamond structure following a strong bounce from recent lows. This setup suggests the memecoin is settling into a consolidation phase rather than gearing up for an immediate trend reversal.
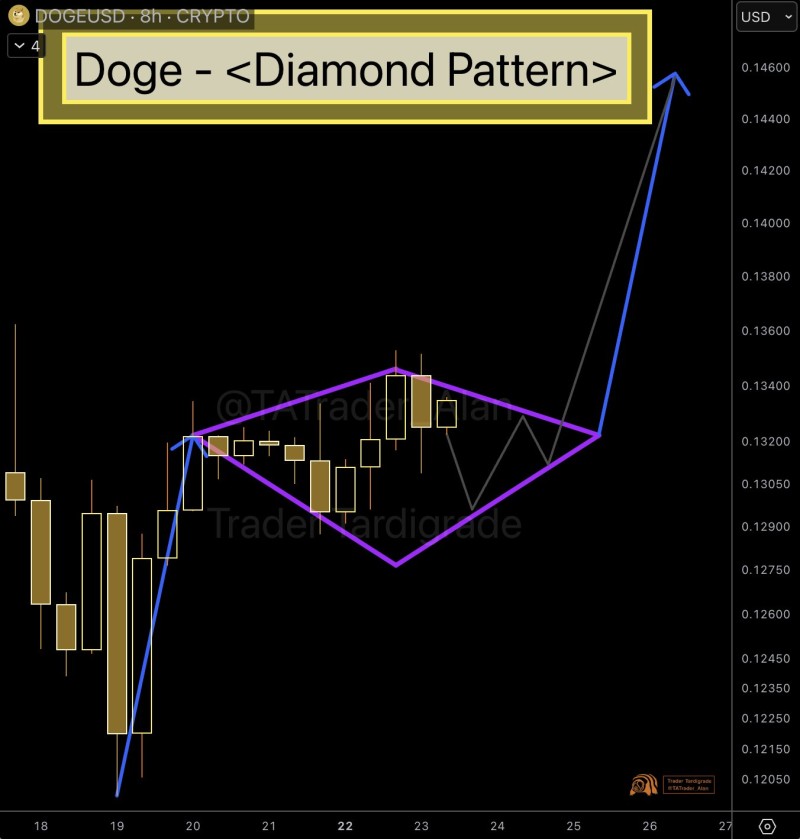
⬤ The pattern displays the classic diamond geometry—price swings that start wide and gradually tighten as they approach a convergence point. Right now, Dogecoin is trading in a narrowing range, with each successive high and low creeping closer to the pattern's apex. This formation emerged after a sharp upward move, which is exactly when traders typically watch for diamond continuation patterns. While the chart hints at a potential bullish breakout path, DOGE hasn't actually broken out yet.
⬤ Recent trading shows DOGE bouncing around with heightened short-term volatility—big candles leading into the current compression zone. The tighter ranges indicate traders are taking a breather after the earlier impulse move, reassessing where the price might head next. The projected path sketched on the chart shows how DOGE could keep bouncing within the diamond walls before making a decisive break in either direction, highlighting that this pattern is still very much in play and unconfirmed.
⬤ This matters because Dogecoin often moves on sentiment waves, especially when clear technical patterns emerge. Consolidation setups like this one can heavily influence short-term trading psychology as everyone watches for either a breakout confirmation or a pattern failure. As DOGE gets closer to the diamond's apex, whichever direction it chooses could set the tone for momentum across the memecoin space, which tends to react fast to shifts in technical structure and market mood.
 Saad Ullah


