Usman Salis

Bitcoin's long-term chart is telling a story most seasoned market watchers have seen before. A four-year rhythm has quietly governed BTC's behavior for over a decade, and right now, the market may be sitting inside another one of those critical windows — the kind that comes before everything moves.
As Bitcoinsensus pointed out, Bitcoin has historically cycled through roughly one-year accumulation phases before launching into major expansion moves. The monthly chart backs this up with near-textbook precision.
The Repeating Structure Behind BTC's 3 Previous Cycles
Pull up the monthly chart and the pattern is hard to miss. After major peaks in 2013, 2017, and 2021, Bitcoin didn't collapse into oblivion — it consolidated.
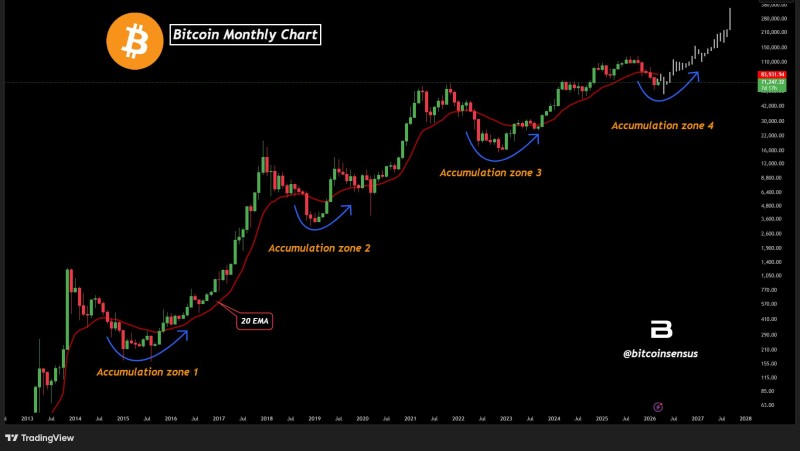
Each time, price formed a rounded base, reset momentum, and then resumed its broader uptrend with force.
Bitcoin has historically followed a four-year cycle, with accumulation phases typically lasting around one year.
The current setup appears to be shaping a fourth such zone. And these phases aren't random noise — they tend to cluster near a specific technical level: the 20-period exponential moving average on the monthly timeframe. Bitcoin has returned to this level before every significant leg up in its history, and the 20 EMA continues to hold as long-term dynamic support.
The Curve That Keeps Showing Up
The 20 EMA isn't just a support line — it's practically a launch pad. Each accumulation phase in Bitcoin's history started the same way: price revisited or briefly undercut this level, formed a curved bottom, and then momentum quietly rebuilt before the market moved decisively higher.
The same structure is visible right now. Price has pulled back into the 20 EMA. A curved base is beginning to take shape. Momentum has reset without breaking the broader long-term trend.
Even now, the broader trend still reflects higher highs and higher lows — a hallmark of sustained bullish structure.
Corrections in this framework aren't reversals. They're resets. Bitcoin's weekly structure has already shown signs of this kind of transition, with temporary deviations in higher-low sequences often absorbed into the broader consolidation rather than marking trend failure.
Compression Before Expansion
What makes this moment stand out is the timing. Across every previous cycle, consolidation followed major tops, price stabilized near long-term support, and breakouts led into exponential growth phases — all within roughly a one-year window.
Accumulation phases often coincide with reduced market activity and slower momentum — conditions that have historically preceded large directional moves.
Current market conditions fit that description. Volume is subdued. Sentiment is mixed. The kind of quiet that has historically come just before things get loud.
Bitcoin's monthly MACD is also flagging a potential cycle transition, adding another layer of confluence to the broader picture.
When Structure Becomes the Signal
The chart isn't showing a breakdown. It's showing a continuation — the same kind of continuation that has defined Bitcoin for more than a decade. If the current accumulation zone follows historical precedent, the market may still be in a preparatory phase rather than a terminal one.
The structure has been the signal every single time before. Right now, it's saying the same thing again.
 Usman Salis