 Saad Ullah

A technical pattern that has marked the end of every major Bitcoin bull cycle is appearing again. The MACD (Moving Average Convergence Divergence) on the monthly BTC/USD chart is showing early signs of a potential bearish crossover—the same setup that preceded Bitcoin's deepest corrections.
What History Shows
Analyst Ali notes that "every time the MACD has crossed bearish on the monthly chart, Bitcoin has seen an average drop of about 70%." The historical data backs this up, with four distinct periods where this signal aligned with brutal, multi-month downturns.
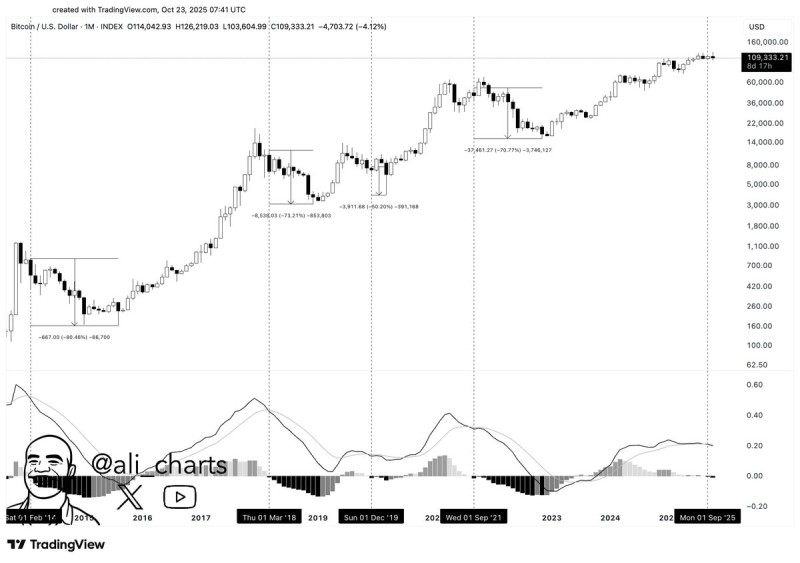
The pattern has played out repeatedly. In 2014, after Bitcoin topped near $1,100, it collapsed roughly 80% to around $220. The 2018 cycle saw a similar story—a MACD crossover marked the end of the 2017 rally, triggering a 73% drop from $19,800 to $3,200. Most recently, the 2021-2022 decline followed the same script with a 70% fall from approximately $69,000 down to the $15,000-$19,000 range.
Now, with Bitcoin trading near $109,000, the setup looks eerily familiar. The MACD histogram is flattening and the signal lines are converging—classic signs that bearish momentum could be building. The chart on a logarithmic scale shows each major peak followed by deep retracements: -80.46%, -73.21%, -50.20%, and -70.77%. The MACD below displays clear cyclical swings—large peaks during bull runs followed by extended negative phases. As of late 2025, the indicator sits at the same turning point seen before every past correction.
Why This Time Might Be Different
Despite the ominous technical signals, today's Bitcoin market has evolved significantly. Spot Bitcoin ETFs have brought institutional money and sustained inflows that didn't exist in previous cycles. Global liquidity remains supportive despite inflation concerns, with easing monetary policies helping fuel crypto demand. And the 2026 halving event looms on the horizon—historically, Bitcoin tends to recover several months after halvings reduce new supply. These factors could potentially soften or delay any correction, even if the MACD crosses bearish.
Every previous MACD-triggered correction eventually led to a new cycle and higher all-time highs. For long-term holders, these signals often mark transition periods where short-term risk spikes but accumulation opportunities emerge. The indicator's real value isn't in triggering panic—it's in revealing when growth has outpaced underlying momentum. The crossover doesn't pinpoint exact tops, but it has consistently aligned with the cyclical reversals that have defined Bitcoin's decade-long pattern.
Bitcoin's monthly MACD is approaching another critical crossover—a setup that historically has meant 60-80% pullbacks. With BTC near $109,000, the signal is a reminder that bull markets don't run forever and cycles tend to repeat. But here's the thing: every past downturn has ultimately reset Bitcoin's foundation for its next exponential move. If history rhymes, a potential correction could be the final shakeout before Bitcoin's next major leg higher. Volatility isn't just a risk in this market—it's part of the DNA.
 Saad Ullah


