 Alex Dudov

⬤ Bitcoin stabilized after a sharp reaction near a major horizontal level on the 3-day chart. BTC showed a V-shaped bounce from around $60,000, suggesting a potential local bottom following recent forced selling pressure.
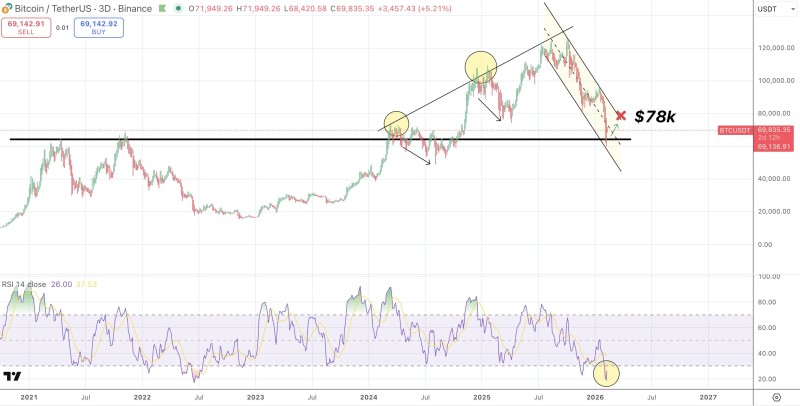
⬤ The chart highlights repeated reactions around the same structure where previous pullbacks were often mistaken for trend reversals. This time, price again reacted strongly at support and quickly recovered rather than continuing lower.
⬤ Similar market structure discussions appear in Bitcoin bearish pattern analysis, where the $60K area acted as a decisive technical level that held firm despite mounting pressure.
⬤ Focus now shifts toward resistance near $78,000, which marks the next major reaction zone if momentum continues. Comparable consolidation and breakout behavior has also been described in Gold holds above key support after rally and broader macro flows impacting digital assets in China cuts Treasury holdings and volatility rises.
⬤ The development matters because repeated defenses of large support zones often anchor sentiment across the crypto market. Holding above $60,000 keeps the broader bullish structure intact, while rejection near $78,000 would likely extend consolidation and maintain elevated volatility across digital assets. Traders are closely monitoring volume and momentum indicators to gauge whether Bitcoin can push through resistance or faces another period of range-bound trading.
 Alex Dudov


