Saad Ullah

⬤ Bitcoin action heated up as price dropped into the $64,500 liquidity zone following a bearish weekly open and a long liquidation event. BTC bounced back after absorbing liquidity in that lower range, showing just how much attention this support area is getting. Bitcoin's moves after capturing that liquidity reveal how structural levels are driving short-term price action.
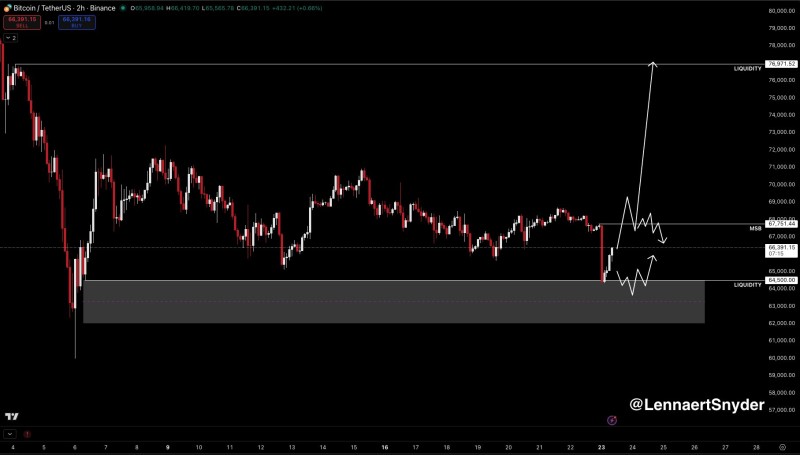
⬤ BTC is currently caught in a tug-of-war between the supply cleared at $64,500 and an important resistance level around $67,751. The Binance BTC chart shows this battle clearly, with the potential push back toward $67,751 acting as a breaking point for bulls. If Bitcoin can reclaim ground above that level, technical scenarios point toward an extended liquidity cluster near $76,971, where resting orders might be stacking up. On the flip side, continued weakness below $67,751 could trap the market in a consolidation range.
⬤ Within this range, BTC's moves mirror broader market sentiment tied to key liquidity zones. Lower weekend liquidity has seen Bitcoin swing near critical pivot points, with the CME futures close and demand zones between $64,000 and $66,500 providing support. That BTC's consolidation around the mid-$60,000s is shaping the near-term narrative as traders eye a potential $70K move or breakdown.
⬤ This liquidity-based setup shows how Bitcoin's structural geography impacts price discovery. Because BTC's moves are influenced by both lower support holds and potential upside pressure near key resistance points, watching how price interacts with these zones frames the bigger picture. Whether BTC can shift from absorbing liquidity to reclaiming higher structure levels will signal where momentum is heading.
 Saad Ullah