 Peter Smith

⬤ Binance Coin is sitting right below a major resistance zone around $934 on the daily chart. This price level has become the focal point for traders watching BNB's next move. The coin has been climbing steadily from the lower $800s, and now it's testing what used to be support but has flipped into resistance. The chart shows BNB trying to reclaim ground after getting knocked down from its earlier highs this cycle.
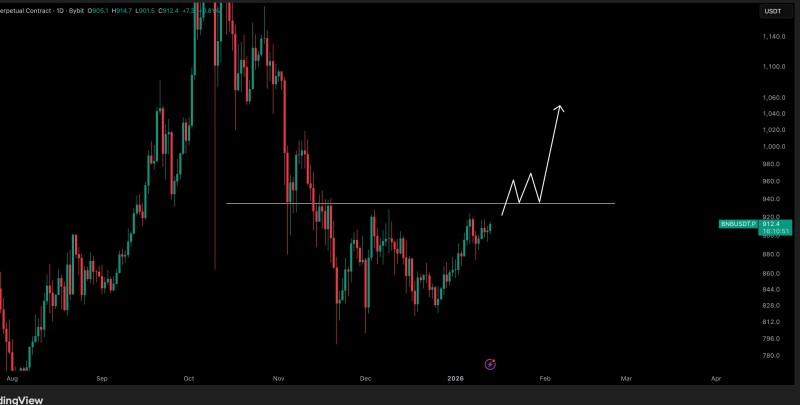
⬤ The recovery looks solid so far—BNB has been making higher lows since bottoming out, which is always a good sign. But here's the thing: it's now bumping up against the $930-$940 range where it previously spent time consolidating. That zone is acting as a ceiling right now, and the price is kind of hovering just underneath it. It's like BNB is catching its breath before deciding what to do next.
⬤ Looking at the technical picture, that horizontal resistance line is basically the wall BNB needs to break through to keep the rally going. The bounce has been nice and steady, but we haven't seen a convincing daily close above this level yet. Until that happens, this is still just a test run, not a confirmed breakout. The chart projection makes it clear—get above this zone and stay there, or the upside momentum stalls.
⬤ This setup matters beyond just BNB itself. Binance Coin often moves in sync with other major altcoins, so what happens here could signal where the broader market is headed. The fact that BNB is holding those higher lows shows things are stabilizing, but $934 is the line in the sand. Break above it with volume, and we could see real momentum building. Get rejected, and BNB probably stays stuck in this range for a while longer. Either way, how the market reacts at this level will tell us everything we need to know about what's coming next.
 Peter Smith


