 Saad Ullah

⬤ BNB, the native token of Binance, is trading just above the important $600 support region as price action pushes against a local descending trendline. The asset is currently in a key squeeze area where recent downside pressure has eased and buyers are testing the demand zone. The chart shows Binance Coin stabilizing around this horizontal support level after a steep correction from higher price ranges earlier in the year.
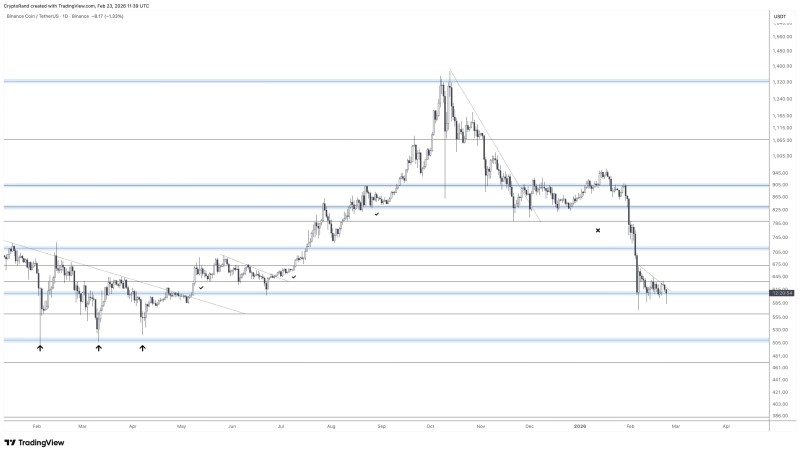
⬤ The daily chart structure reflects Binance Coin price analysis with a clear series of horizontal support and resistance bands. BNB declined sharply from near the $900s and $800s earlier in 2026 before finding a base around the $600 level, where price has bounced and entered a phase of tighter consolidation. This support zone has been tested multiple times, and the recent failure to decisively break below it suggests that buyers are defending this area. At the same time, price is approaching the downward sloping trendline drawn from earlier highs, creating a technical squeeze as BNB attempts to breach resistance overhead.
⬤ On the upside, traders are watching whether BNB price can reclaim and hold above the local downtrend line. Success here could signal a broader shift from pure consolidation back into a more constructive trend, with potential resistance zones lying above in the $700s. Conversely, failure to break above this compression zone could leave price range-bound, with renewed downside risk if the $600 support eventually gives way.
⬤ The importance of this setup lies in the broader implications for Binance Coin (BNB) trend dynamics. Holding the $600 zone while testing downtrend resistance underscores a balance between sellers and buyers that often precedes decisive movement in either direction. How price resolves this squeeze could influence sentiment across related crypto markets, given BNB's role as a bellwether among major exchange-linked assets.
 Saad Ullah


