 Saad Ullah

⬤ BNB is trading inside a key support region near the $600 level after a sharp corrective decline on the daily chart. Price action shows tight consolidation directly above the demand zone, indicating slowing bearish momentum. The current reaction may determine whether a rebound phase begins.
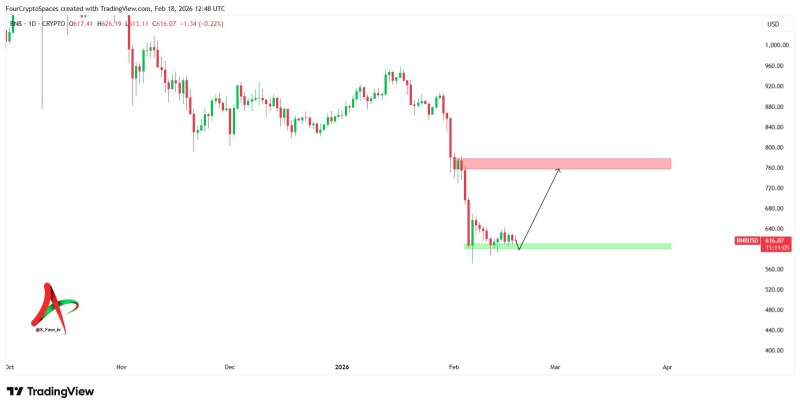
⬤ The chart highlights a transition from impulsive selling into sideways movement within the support band. Instead of continuing downward immediately, price is attempting to stabilize around the marked base area. "The current reaction may determine whether a rebound phase begins," according to the analyst's latest update. Similar resistance pressure around recovery attempts was discussed in BNB price analysis: Binance Coin stuck below 668 resistance.
⬤ The nearest resistance sits around the $760 region, identified as the next overhead supply zone. If the $600 support holds, the structure presents an open technical path toward that level as downside pressure fades and balance forms near the lows. A comparable corrective reaction after a strong drop was outlined in BNB tests 421 support after 38% drop from 910 peak.
⬤ The importance of this setup lies in the reaction at structural support. Acceptance above $600 would indicate a shift from correction toward recovery, while a breakdown below the zone would extend the existing bearish phase and delay any upward continuation. Traders are now watching for volume expansion and sustained price action above the demand zone to confirm whether BNB can mount a meaningful recovery attempt toward the $760 target or if further downside pressure will emerge.
 Saad Ullah


