Usman Salis

⬤Cardano has been grinding lower for months, but the weekly chart is starting to look different. Price is hovering around the $0.27 area, forming tight consolidation candles after a steep decline. Selling has clearly slowed, and the market seems to be searching for a floor.
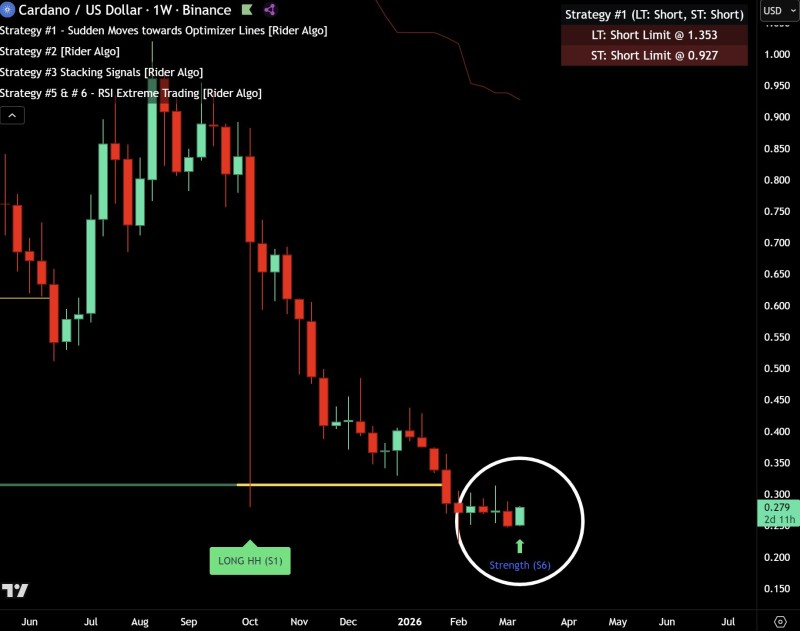
⬤A bullish S6 signal is now approaching confirmation - a technical indicator built to flag when an overextended decline starts losing momentum. The signal is forming right at the bottom of the recent price structure, where candles have clustered into a tight consolidation zone. A similar setup played out in ADA Price Analysis: Cardano Holds Above Critical $0.24 Support Zone, when the asset stabilized after a prolonged selloff near key support.
⬤The broader structure still shows a clear sequence of lower highs and lower lows - this is still a downtrend on the macro level. But current consolidation suggests a possible shift from aggressive selling toward a more balanced market phase. As covered in ADA Price Analysis: Cardano Tests $0.384-$0.391 Micro Support Zone, how price behaves around these support areas tends to determine whether a recovery forms or the decline deepens.
⬤The S6 signal points to a potential turning point - but it's not a guarantee. Whether this leads to a real reversal or just a brief pause will depend on how buyers and sellers interact near current levels. Prior analysis in ADA Price Analysis: Bullish Divergence Emerges Near $0.35 Support flagged similar weakening downside momentum - a pattern worth watching closely as ADA tries to stabilize.
 Usman Salis