 Alex Dudov

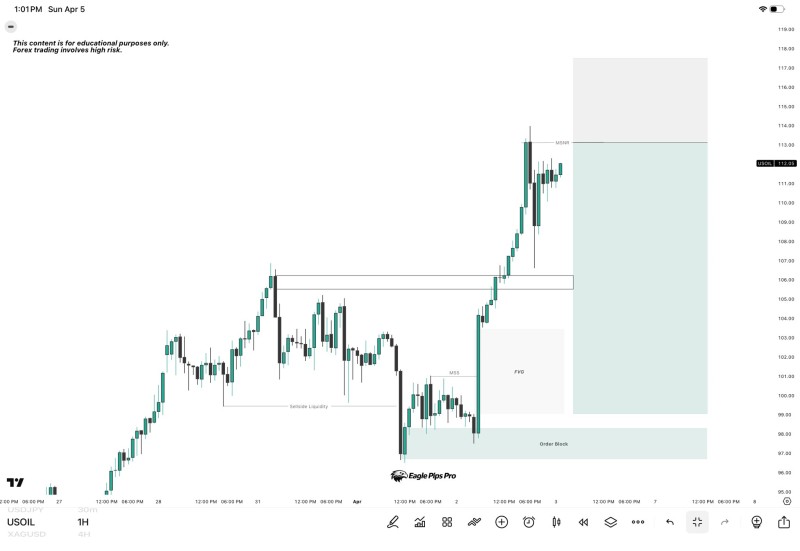
Crude oil has rallied sharply into a defined resistance zone and is now consolidating near the highs. Analyst Eagle Pips Pro flagged the 106.00-108.00 area as the key level to watch, pointing to early rejection signals that suggest potential distribution is underway.
The chart structure supports this read. After a strong impulsive push higher, price stalled as it entered resistance, with candles forming upper wicks - a sign that buyers are losing control near the highs. Similar behavior appears regularly in WTI oil price action when price approaches technically significant barriers.
The 106.00-108.00 zone is the key level to watch, with rejection signals suggesting potential distribution.
Where USOIL Momentum Is Slowing
The current setup shows a textbook transition from expansion into hesitation. Price is no longer trending aggressively but compressing at the top of the move - a pattern that often precedes a directional resolution. Wicks on recent candles are doing the talking, with sellers stepping in each time price tests the upper end of the range.
This kind of behavior is well-documented in oil technical analysis. When price reaches a key zone after an extended move, momentum fades and reactions become more volatile as the market decides whether to reverse or push through. The USOIL resistance pattern at these levels mirrors prior setups where consolidation at highs resolved into a sharper pullback.
Price is pushing into resistance after an extended move - this shift from impulse to pause is a common feature when crude oil reaches key technical zones.
Key USOIL Levels That Define the Trade
The setup comes with clearly defined parameters on both sides:
- Resistance zone: 106.00-108.00
- Risk level (invalidation): 109.50
- Downside targets: 103.50 - 101.80 - 99.50
These levels structure the trade without adding assumptions beyond the original analysis. A hold at resistance opens the path toward 103.50 first, with 101.80 and 99.50 as deeper targets if momentum shifts lower. A clean break and close above 109.50 would flip the structure back toward continuation. Traders monitoring WTI crude resistance levels have seen this type of setup play out across multiple timeframes in recent months.
If resistance holds, the structure favors a move lower toward 103.50, 101.80 and 99.50 - but a break above 109.50 shifts the setup back toward continuation.
What Decides the Next USOIL Move
The setup is conditional. USOIL is not confirming a reversal or continuation at this stage - it is reacting at resistance. Oil markets tend to be highly reactive around such zones, where a hold or break often sets the tone for the next directional phase. The outcome depends entirely on how price behaves at the 106.00-108.00 ceiling over the coming sessions.
 Alex Dudov


