 Eseandre Mordi

For the first time in decades, silver has broken decisively above a resistance zone that had capped price action across multiple market cycles. This isn't a routine move - it's a rare structural shift on the long-term chart, with price now holding above former resistance and maintaining strong upward momentum. Gold Predictors flagged this development, pointing to the technical significance of what just happened.
How a Multi-Decade Ascending Triangle Shaped Silver's Price
The pattern behind this breakout took years to build. Silver completed a multi-decade ascending triangle - a structure defined by rising lows compressing against a flat resistance ceiling near the $35-$37 region.
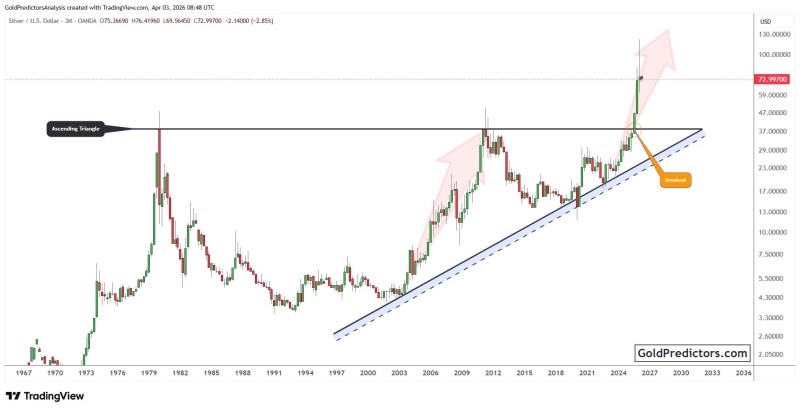
That kind of formation reflects sustained upward pressure, where buyers consistently step in at higher levels while sellers defend a fixed zone.
Silver completed a multi-decade ascending triangle - a structure defined by rising lows compressing against a fixed resistance ceiling, reflecting sustained upward pressure over multiple market cycles.
Each test of that ceiling failed to produce a clean breakout - until now. The long-term ascending trendline supported price from below across multiple cycles, while the horizontal resistance held firm. That compression eventually gave way.
Silver Clears $35-$37 Resistance - Why This Breakout Is Different
The breakout itself is clean and decisive. Price moved above the long-standing resistance and accelerated sharply, confirming that the ceiling has been removed. This type of move typically signals a shift in market structure rather than a short-term fluctuation.
What makes it convincing is what came after. Price is now holding above the former resistance zone - and in technical analysis, that transition where resistance turns into support is the key confirmation signal that a breakout is valid and being accepted by the market. Silver breakout holds after wedge retest examines exactly that dynamic, showing how maintaining price above a broken structure reinforces the broader trend shift.
Silver Momentum Expands Toward $70 After Years of Compression
After years of constrained movement within the triangle, price has moved sharply higher, pushing toward the $70 range. That's the classic expansion phase following prolonged consolidation - and it follows a well-established pattern in silver's history.
A similar dynamic played out during the move covered in Silver surge to $79 breakout rally, where clearing resistance led to rapid continuation and strong momentum. The structure on the chart supports that comparison:
- Higher lows forming into resistance over time
- A flat resistance level tested repeatedly before breaking
- Strong continuation immediately after the breakout
Silver's 50-Year Pattern Break Points to a Higher Pricing Regime
With resistance now cleared, silver is no longer trading within its previous long-term range. This breakout suggests a shift into a higher pricing regime - one where previous ceilings no longer define market boundaries.
Long-term breakout patterns of this scale are rare. When they occur, they tend to mark genuine trend regime changes rather than temporary momentum moves.
Long-term breakout patterns of this scale don't appear often. When they do, the historical precedent matters. A closely related setup is analyzed in Silver breaks 50-year pattern, which outlines how multi-decade structural breaks have historically marked major transitions in trend direction.
Price holding above the breakout zone remains the defining signal. As long as that structure stays intact, the chart reflects a market that has shifted from compression into expansion - with buyers maintaining control above what used to be a ceiling.
 Eseandre Mordi


