Alex Dudov

Oil markets are approaching a potentially sensitive zone as momentum accelerates toward historically significant levels. The long-term chart shows the 12-month rate of change (ROC) rising sharply, nearing a threshold that has previously aligned with major equity market stress. As Ted noted, the indicator is close to entering what he calls a "danger zone" - where past spikes have coincided with stock market sell-offs.
The indicator is approaching a level that has historically mattered every single time it was reached - and markets paid a price for ignoring it.
A Rare Signal in Oil That Appears at Extremes
The chart highlights a recurring pattern: whenever oil's 12-month ROC exceeds 100%, major market disruptions tend to follow. These spikes are marked at key historical moments - 1987, 1990, the dot-com era, 2008, and the 2022 bear market. WTI Crude Oil has already surged above $84, up 55% since December, which puts the current momentum reading in context.
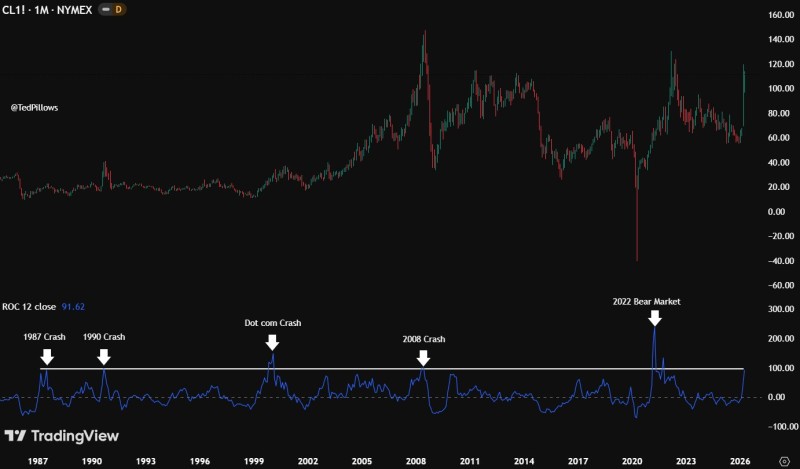
What makes this signal notable is its rarity. Oil does not frequently experience such rapid annual price acceleration, and when it does, it reflects extreme shifts in market conditions - not just supply dynamics, but often broader macro dislocation.
Extreme momentum in oil has never been just a commodity story - it bleeds into equities, credit, and consumer sentiment in ways that take months to fully price in.
Why the Current Oil ROC Reading Near 92% Matters
The ROC is currently around 92%, placing it just below the historical trigger level. While not yet in the danger zone, it is approaching a level that has consistently mattered in previous cycles. This surge reflects strong upward momentum in oil prices, similar to recent market behavior where crude has moved through key technical levels. WTI oil price analysis shows crude breaking $65.39 and now eyeing the $68-$69 level as the next zone of interest.
Such rapid moves in oil are not just isolated commodity events. They often signal broader stress across markets - from energy-sensitive sectors to consumer discretionary names and high-yield credit.
The 100% Threshold That Could Shift Oil Market Dynamics
The key level to watch is the 100% ROC threshold. A move above it would align the current cycle with prior extreme events. Here is what the data shows:
- ROC is nearing the critical 100% level
- Historical spikes above this level coincide with equity drawdowns
- Current momentum is trending toward that threshold
This dynamic becomes especially relevant as oil volatility continues to increase. WTI oil futures have already signaled a corrective phase after a 5-wave drop to $65, showing how quickly sentiment can shift in response to supply and macro developments.
The 100% ROC level is not a soft warning - it is a line that has separated normal cyclical momentum from genuine market stress, every time it appeared in the historical record.
Related technical analysis also highlights how oil's price structure can rapidly transition between expansion and correction phases, reinforcing the importance of key momentum thresholds. For now, oil has not yet entered the "danger zone." But with momentum building, markets are approaching a level that has historically coincided with heightened risk for global equities.
 Alex Dudov