Peter Smith

Global crude has entered a new phase of momentum after a long stretch of weakness. Average prices hit $95.6 per barrel in March, and the chart tells a clear story: a powerful breakout from a multi-year downtrend that puts the $100 threshold firmly back on the table.
A Long Oil Price Decline Reverses With Force
From the 2022 peak near $117, crude entered a sustained downtrend defined by lower highs and increasingly weak rallies. Through 2023 and 2024, price action stayed volatile but structurally soft, with repeated failures to reclaim the $90-$100 zone.
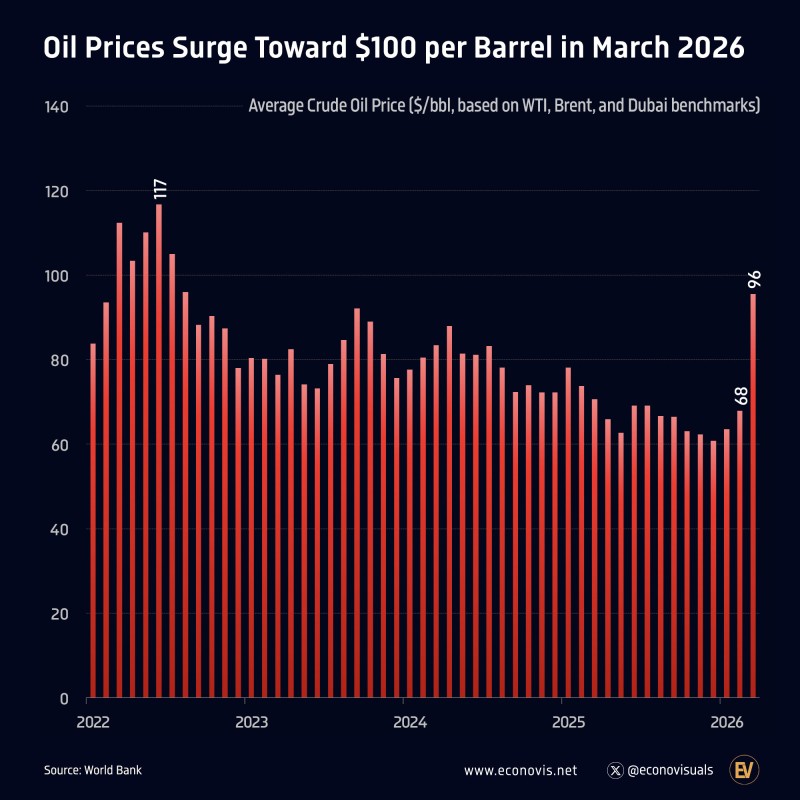
By 2025, that pressure deepened as prices drifted toward the low-$60s, carving out a clear base after months of decline. Selling momentum gradually slowed, and price began stabilizing rather than breaking to new lows.
As Econovis highlighted, March delivered a sharp acceleration - prices surged 40.5% month-over-month and rose 57% year-to-date, marking one of the strongest short-term moves in recent years. That base has now resolved convincingly to the upside.
From Base Formation to Vertical Oil Price Expansion
The most striking feature of the current move is its speed. After spending much of 2025 compressing between roughly $60 and $75, oil broke decisively above that range, with momentum carrying prices into the mid-$90s.
This kind of move reflects a shift from accumulation into expansion. Recent price behavior shows:
- A clear floor established in the $60-$65 range during 2025
- A breakout through the $75-$80 region, which previously capped rebounds
- A rapid extension into the $90+ zone without meaningful pullbacks
Such vertical moves tend to occur when markets exit prolonged consolidation phases, triggering accelerated price discovery.
Markets exit prolonged consolidation phases, leading to accelerated price discovery as price searches for the next equilibrium.
The Return of a Critical Psychological Barrier at $100
With oil now approaching $96, attention shifts naturally to the $100 level - a threshold that has shaped market behavior for years. Previous attempts to hold prices near or above it were short-lived, particularly after the 2022 spike. That high remains the dominant reference point, and the market is once again closing in from below.
As WTI oil's break above $84 showed earlier this cycle, once key resistance zones give way, crude can accelerate quickly - especially during periods of heightened volatility. The current move mirrors exactly that dynamic.
Once prior ceilings give way, crude can accelerate quickly during periods of heightened volatility, with price transitions happening faster than most expect.
Oil Momentum Builds Into Uncharted Territory
The broader structure makes one thing clear: oil is no longer trading within its prior downtrend. It has shifted into a new regime defined by sharp upward momentum.
There is little meaningful resistance between the mid-$90s and the 2022 highs, leaving the market in a relatively open zone. That setup often leads to increased volatility as price searches for the next equilibrium.
Historical precedent is worth keeping in mind here. As the 2022 surge to $114 demonstrated, extreme moves in crude can reverse just as sharply as they develop. Prior spikes were followed by equally aggressive corrections once sentiment shifted.
Sentiment can reverse quickly once oil approaches extreme levels, with prior spikes followed by equally sharp corrections that reset the entire structure.
And this is not oil's first recovery from a multi-month slide. The 4.6% January 2026 rebound after five months of declines was an early signal that the trend was turning. What followed was something far more forceful.
For now, the chart reflects a market that has broken decisively from its previous structure - one that is rapidly approaching a level that has repeatedly reshaped oil price behavior in the past.
 Peter Smith