 Usman Salis

Natural gas is once again punishing anyone trying to pick a side. Writing for ArcisFX, the analyst breaks down a chart pattern defined by repeated fake moves — each one triggering stops before reversing, leaving traders on both ends of the market empty-handed.
A Market Defined by Repeated Sweeps
The broader structure shows a downtrend slowly giving way to tight consolidation. Price keeps breaking short-term highs and lows, only to snap back almost immediately after. This is textbook liquidity sweep behavior — the market drifts just far enough to run stops, then rotates back into range.
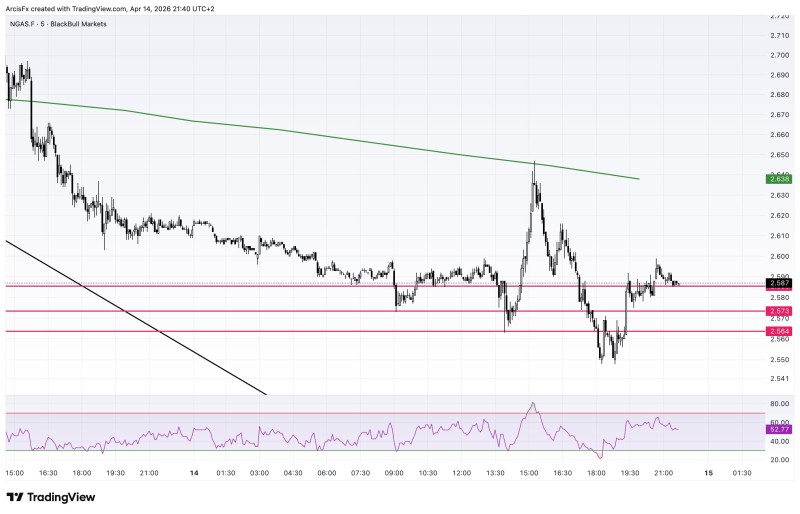
The chart shows a sequence of liquidity sweeps — a pattern that continues to punish bottom-pickers and premature positioning.
Multiple sweeps have now printed on both sides of the range, and that repetition matters. It signals a market that isn't trending — it's actively clearing positions before it commits to any move. Traders expecting follow-through have been repeatedly burned.
Natural Gas Compresses Between 2.56 and 2.59
Price is now locked in a narrow band between 2.56 and 2.59, with both edges being tested and rejected on a loop. What looked like support and resistance levels have turned into traps — price pokes through, triggers orders, then pulls right back. Natural Gas Holds $2.86-$2.93 Micro Support Zone Amid Descending Trendline Pressure documents a similar dynamic where consolidation near key support zones delayed any meaningful directional break for an extended period.
Price is compressing inside a narrow range - a condition that often precedes a larger move but offers little clarity in the moment.
The structure is compressing rather than expanding. Breakouts fail quickly, and equilibrium reasserts itself each time. That compression can precede a significant move — but it offers no reliable signal about which direction that move will take.
Natural Gas Volatility Makes the Pattern Worse
Natural gas has always been one of the more unforgiving markets to trade, capable of sharp reversals with little warning. The current environment reflects exactly that character. Moves lack follow-through. Positioning gets invalidated fast. Natural Gas Tests $3 Support After 8% Drop showed just how quickly the market can reprice when technical pressure builds — a reminder that the eventual break from this range could be fast and one-sided.
Until price breaks cleanly out of the current range, the pattern of liquidity sweeps is likely to continue.
For now, the message from the chart is simple: neither side has control. Until natural gas posts a clean break outside the 2.56-2.59 band with real follow-through, Why Natural Gas Trading Carries 50-120% Volatility Risk explains why this kind of environment — high volatility without direction — is precisely where undisciplined positioning tends to get punished most.
 Usman Salis


