 Peter Smith

⬤ Natural Gas is sitting at a critical junction. The market failed to push above the 200 EMA, and a spinning top candle right at that level said everything — neither side was in full control. Then the next session gapped down, confirming sellers hadn't given up. That candle was the tell: a textbook standoff that resolved in favor of the bears.
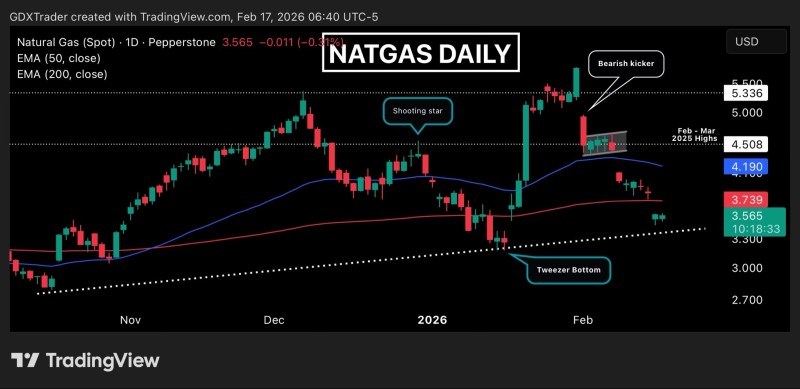
⬤ On the daily chart, NATGAS is hovering around $3.56 — well off the February–March highs near $4.50 and still under the 200 EMA ceiling. There was a small lower wick and a mild bounce into the close, but neither had enough behind them to suggest a real shift in momentum. Price is now drifting toward the ascending trendline, which becomes the next real test. Natural gas support tests.
A spinning top candle right at the 200 EMA is a standoff — and the gap down the next day told us who won.
⬤ Zoom into the hourly chart and there's a falling wedge forming — but don't mistake that for a bullish setup yet. This is compression, not reversal. The bearish structure stays intact until price breaks above wedge resistance and holds. Until then, what you're seeing is controlled selling, not accumulation. resistance rejection structures and energy volatility setups across commodity markets have shown the same pattern.
⬤ Where NATGAS goes from here is a binary setup. A confirmed move above resistance flips the structure and opens room to the upside. A failure to hold current support keeps the downward bias in play. The reaction at these two levels — trendline support and wedge resistance — will define the next meaningful leg for the commodity.
 Peter Smith


