 Marina Lyubimova
⬤Ripple's XRP remains locked in a consolidation structure on the 4-hour chart, fluctuating between the 0.618 resistance at $1.47 and the 0.5 support level at $1.33. With price currently hovering near $1.35, the market is in a holding pattern while traders wait to see whether the lower boundary will hold or crack under pressure.
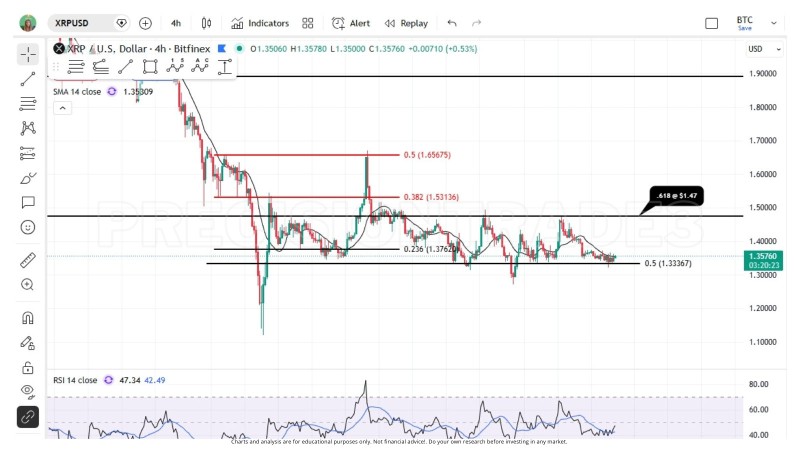
⬤Both levels have seen repeated reactions in recent sessions. The $1.47 zone has consistently rejected upward attempts, while $1.33 has served as the floor of the range. This type of sideways grind is typical during consolidation phases, when momentum stalls and the asset oscillates between defined boundaries. A similar pattern played out earlier when XRP traded sideways below resistance near $1.50 while support remained relatively soft.
⬤A breakdown below $1.33 would expose deeper retracement targets. The chart flags the 0.786 Fibonacci level near $0.87 as the next meaningful support if the range floor fails. Fibonacci retracement zones are widely used by traders to map where price might stabilize during corrective moves, and this level would represent a significant pullback from current prices.
⬤The broader picture for XRP still depends on how price reacts at these Fibonacci boundaries. If the $1.33 to $1.47 range holds, XRP could keep compressing before a sharper move develops. The direction of that breakout, whether higher toward $1.47 and beyond or lower toward $0.87, will be the key signal traders are waiting for in the sessions ahead.
 Marina Lyubimova


