 Usman Salis

⬤Bitcoin is drawing fresh attention from market watchers after sliding into deeply oversold territory on the weekly chart. As reported by @shardib12, the recent leg down left BTC looking exhausted following sustained selling pressure. Price is currently hovering near the $68,000 region, trading below the 200-week moving average — a long-term indicator closely tracked during major corrections.
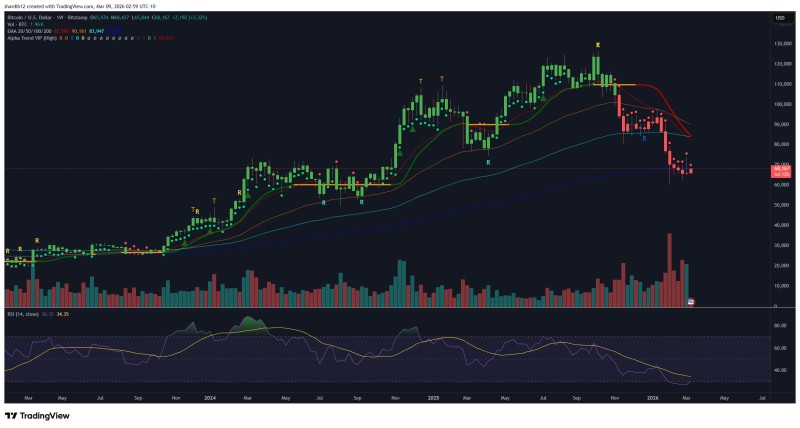
⬤Looking back at the previous cycle, Bitcoin had surged sharply to highs above $120,000 before momentum started fading. Since then, a steady sequence of declining weekly candles has pushed BTC toward the lower end of its long-term structure. Price currently sits beneath several key moving averages, reflecting the ongoing corrective phase that followed that earlier peak.
⬤The weekly RSI is the standout signal here. It has entered oversold territory — a condition that's appeared only a handful of times across Bitcoin's entire trading history. Each prior occurrence showed up during periods of intense market stress, often just before stabilization or the early stages of a recovery. This dynamic is explored further in BTC Weekly RSI Hits Oversold Again as Long-Term Channel Holds, where analysts link these rare oversold readings to historically significant turning points.
⬤Despite the current weakness, the bigger question is how BTC behaves around these long-term levels. Oversold momentum on higher timeframes signals stretched selling, but markets can stay volatile before any resolution. The interplay between price, the 200-week MA, and the weekly RSI will determine whether this move represents a deeper correction or a stabilization within Bitcoin's broader cycle. For context on where price could head next, see Bitcoin Price to USDT: $111K Pullback Sets the Stage for a Potential Mega Rally.
 Usman Salis


