 Usman Salis
⬤Netflix is testing a technically significant area on the weekly chart following a sharp pullback from recent highs. The stock has retreated toward the $99 region and is now approaching the 0.5 and 0.618 Fibonacci retracement levels near $85–$82, a zone that traders closely monitor during corrective phases within broader uptrends.
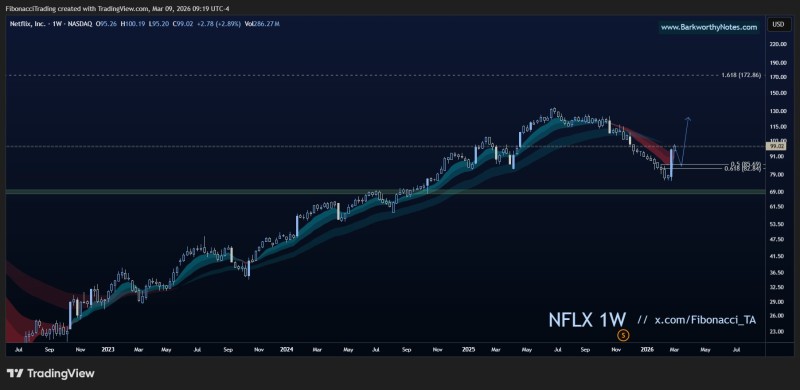
⬤Through 2023 and 2024, NFLX built a strong bullish structure marked by higher highs and higher lows, with price consistently finding support within the moving average cloud on the weekly chart. The current decline has pushed the stock into a deeper retracement, bringing it into contact with that key Fibonacci support band for the first time in the cycle. Netflix has now logged a 9-week losing streak, sweeping the $80 support area and raising questions about near-term stability.
⬤Technical traders treat these Fibonacci levels as natural inflection points. A stabilization here that forms a higher low, followed by a reclaim of the trend cloud, would keep the longer-term bullish case intact. Notably, institutional interest has not vanished: Netflix recently saw over $60M in whale call buying spread across 8 strike prices, signaling that large players may be positioning for a bounce rather than a breakdown.
⬤The reaction around this Fibonacci zone will define the next phase for NFLX. A confirmed hold here could reinforce the bullish structure built over two years and set the stage for a resumption move. Failure to hold, however, would extend the correction and force a broader reassessment of momentum in the stock.
 Usman Salis


