 Artem Voloskovets

⬤Tesla has caught the eye of technical traders after a rounded top structure started forming on the weekly chart, pointing to fading bullish momentum. The pattern emerged following a solid rally earlier in the cycle, with TSLA now trading near the $396 region after gradually stepping back from its highs.
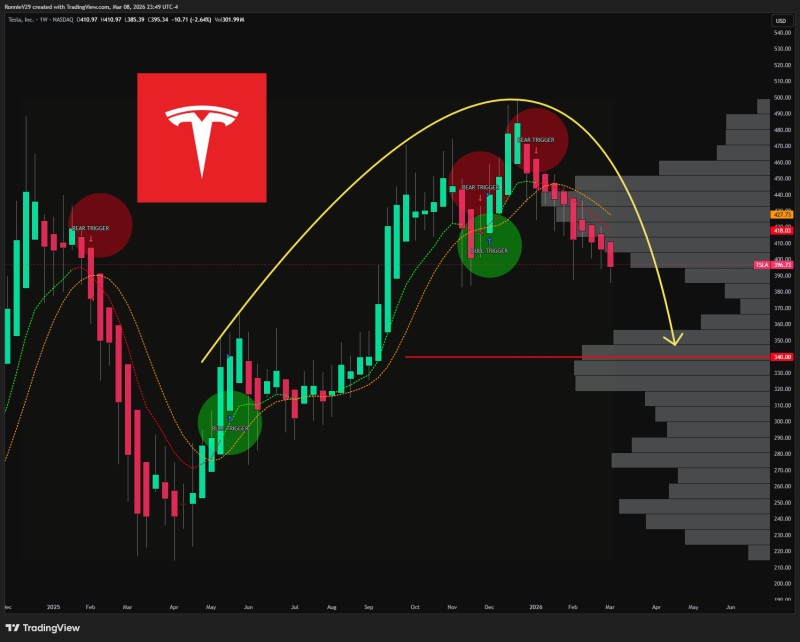
⬤The chart shows Tesla previously pushed into the $490–$500 zone before momentum began to stall. A bear trigger appeared around the $444 mark, and price has been grinding lower since then through a series of declining weekly candles. This kind of rounded top typically shows up after extended rallies when buying pressure fades and sellers quietly take back control.
⬤The $384 level now functions as the critical support threshold to watch. A confirmed close below it could speed up the selloff and open the door toward $340 as the next meaningful floor. As Tesla Tests $383 Support With $410 Break Key to Next Move points out, Tesla is already sitting inside a tight support band between $383 and $396 where the next big directional move is likely to come from.
⬤Broader technical coverage has also flagged weakening momentum across the board. Both TSLA Stock Stays in Correction Below $418.86 Resistance and Tesla Faces Critical $404–$409 Resistance After 3-Month Downtrend note that the stock remains inside a corrective structure with resistance overhead capping any recovery attempts.
⬤Tesla sits at a genuine inflection point. If $384 holds, the stock has room to stabilize and consolidate after the pullback. If it breaks, sellers could push price toward deeper liquidity zones on the chart. Either way, how price reacts around this level will likely set the tone for Tesla's next major move.
 Artem Voloskovets


