 Saad Ullah
⬤Tesla is back at a critical level, retesting support near $383 while trading around the $393 region. This area aligns with the 0.618 Fibonacci retracement, a zone that often acts as a stabilization point during corrections. The repeated return to this level makes it one of the most structurally significant areas on the current chart.
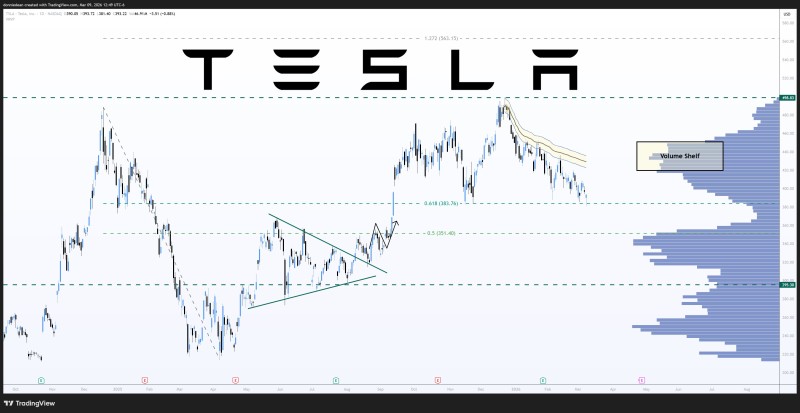
⬤Since peaking at higher levels, TSLA has moved into a corrective phase, gradually drifting lower while facing resistance from a descending moving-average cluster. Multiple retests of $383 suggest buyers are defending the level, but sustained selling pressure could eventually force a breakdown. This mirrors the setup covered in Tesla Tests $383 Support With $410 Break Key to Next Move, where analysts flagged this exact zone as a key decision point.
⬤To the upside, the volume profile shows a significant shelf between $430 and $440, representing heavy historical trading activity. If Tesla manages to hold current support and rebuild momentum, this range becomes the next logical target. Prior analysis in Tesla Price Analysis: Key $507 Resistance and $387 Support identified similar structural levels, pointing to $498 as a higher resistance area if bullish momentum returns.
⬤The $383 zone is now the deciding line for Tesla's next phase. Holding support could keep the broader consolidation intact and open a path toward higher resistance levels. A confirmed break below, however, shifts focus to the next Fibonacci retracement near $351, potentially extending the correction as the market reassesses TSLA's trend. As noted in TSLA Stock Stays in Correction Below $418.86 Resistance, repeated support tests often define the next major directional move.
 Saad Ullah


