 Eseandre Mordi

⬤ U.S. natural gas is sliding after failing to hold above $4, down about 1.5% as the market extends its retreat from recent highs. The daily chart shows prices dipping back under that psychological level, suggesting traders are taking a pause rather than pushing for new highs right away.
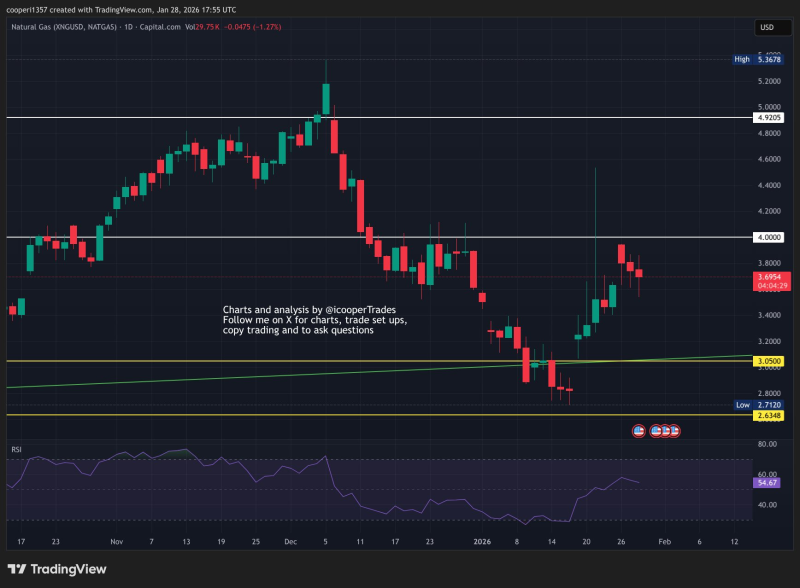
⬤ The $4 zone has become a critical resistance point on the chart. Until buyers can decisively break through, it's acting as a ceiling. If prices do manage to climb above $4, the next major hurdle sits between $4.80 and $5.00, where previous peaks formed. Recent price action shows sellers defending the $4 area, keeping bulls in check for now.
⬤ Looking down, $3.00 stands out as important support that lines up with a rising trendline. This level has held up during previous pullbacks and could stabilize prices if selling continues. If that breaks, the recent low around $2.63 becomes the next target. So far, momentum indicators suggest this is more of a controlled consolidation than a panic selloff.
⬤ This matters for energy markets because natural gas has been swinging wildly in recent months. How prices behave between the $3 support and $4 resistance will shape short-term direction and volatility. Traders across energy markets are watching closely to see if the recent rally can get back on track or if we're headed for sideways trading instead.
 Eseandre Mordi


