Usman Salis
Gold's long-term structure may be mirroring previous cycle tops, but history suggests the market is more likely to enter a prolonged consolidation phase than a sharp decline. The latest price action keeps the broader bullish trend intact, even as similarities to past turning points begin to surface.
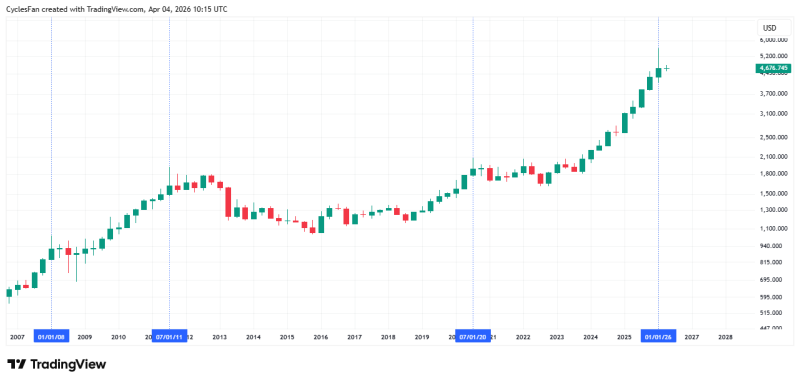
Market analyst CyclesFan pointed out that the current quarterly candle closely resembles formations seen in 2008, 2011, and 2020 - three distinct moments when gold's momentum visibly shifted.
The current quarterly candle closely resembles formations seen in 2008, 2011, and 2020, each of which preceded a transition rather than a collapse.
A Gold Pattern That Has Appeared 3 Times Before
The chart highlights a recurring macro structure where strong uptrends culminate in a similar quarterly candle before transitioning into a slower phase. This is not a new phenomenon - it has played out across three separate cycles:
- 2008 - momentum shifted after a major rally, marking the end of a fast-moving trend
- 2011 - a long-term top formed, followed by multiple quarters without new lows
- 2020 - a similar formation preceded a cooling period before the next leg higher
The current setup aligns with each of these cases, suggesting gold may be entering a comparable stage in its cycle. That said, alignment with a pattern is not the same as a confirmed reversal.
Gold Did Not Make a New Low for 6 Quarters After the 2011 Top
The historical comparison does not imply an immediate reversal. After the 2011 top, gold did not make a new low for six quarters - a detail that reframes the current situation considerably. These structures tend to lead to three things rather than an outright breakdown:
- Extended sideways movement with compressed volatility
- A gradual loss of momentum without a clean directional move
- A transition from trend expansion to range-bound consolidation
After the 2011 top, gold did not make a new low for six quarters - a slow grind, not a crash.
Gold's current position near highs reflects genuine strength. The pace of gains, however, may begin to slow as the market digests the previous upside. Gold near $4,080 is holding within a tightening triangle pattern - a structure that often precedes a breakout or breakdown, but rarely resolves overnight.
Gold Trend Still Intact Despite Slowing Momentum
The broader trend remains bullish, supported by a consistent series of higher highs on the long-term chart. However, the recent candles show less aggressive continuation compared to earlier phases of this rally. That compression is itself a signal - not of weakness, but of a market that may be running out of the easiest gains.
This is consistent with broader observations about how gold behaves after strong multi-month runs. It often enters consolidation phases that raise the breakout vs. bubble question - a debate that historically resolves in favor of the underlying trend, but only after considerable patience is required of holders.
The broader trend remains bullish, but recent candles show less aggressive continuation - a compression that signals a market digesting its gains, not abandoning them.
Gold Entering a Holding Phase With Elevated Prices
The current structure suggests gold may be shifting into a phase where upside becomes harder to achieve, but meaningful downside also takes time to develop. Rather than signaling a clear top, the pattern reflects a market moving toward balance - where buyers and sellers begin to even out after a strong directional trend.
The metal's long-term strength remains evident. Gold hitting $4,300 saw long-term investors beginning to take profits - a natural rotation that can temporarily cap prices without breaking the underlying trend. If history repeats, gold could remain elevated for multiple quarters before any decisive directional move emerges.
 Usman Salis