 Marina Lyubimova

⬤Gold is facing fresh downside pressure after a failed rebound near a descending trendline sent prices sharply lower. The chart shows how price reacted at the trendline retracement before sellers stepped back in and pushed the market below the $5055 support area. The earlier bounce looks like a technical correction rather than a genuine reversal, keeping the short-term bearish structure fully intact.
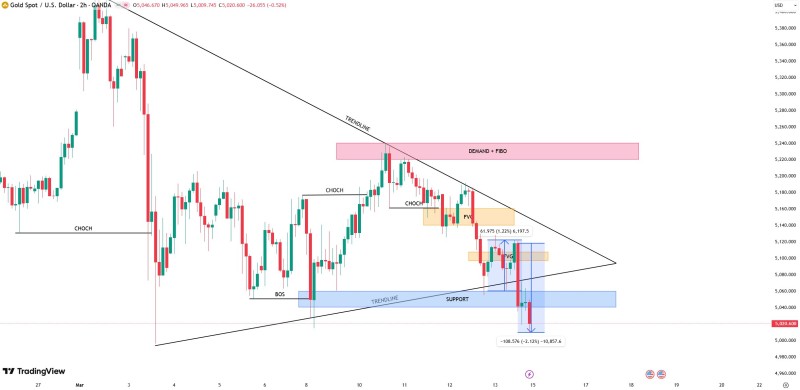
⬤The chart structure tells a clear story. Gold tried to recover from a local demand area and a fair value gap (FVG) zone but stalled beneath the descending trendline and an upper supply region marked "Demand + Fibo." That rejection lined up with earlier change-of-character (CHOCH) and break-of-structure (BOS) signals. Once trendline resistance held firm, selling accelerated and Gold tests $5,000 support after retreat from $5,600 peak -- a pattern confirming the continuation of downward momentum through the $5055 level.
⬤After the support break, gold dropped quickly toward the $5010 area, pointing to liquidity flows toward the lower end of the range. Minor consolidation around imbalance zones was brief before the latest leg lower extended losses. This type of move is typical when liquidity pools beneath support get targeted. As covered in XAU/USD gold price analysis: $4,570 support level determines next move, deeper demand zones can come into play fast once structural levels crack.
⬤Gold now sits near a major psychological level. If price fails to reclaim the $5050-$5070 area -- previously support -- the market could keep testing the $5000 zone where significant order concentration is expected. Trendline rejections combined with weakening bounces suggest sellers remain in control. As analyzed in Gold tests $5,000 as $4,800-$4,600 demand zone comes into focus, how price behaves at $5000 will likely determine whether gold stabilizes or continues its short-term decline.
 Marina Lyubimova


