 Usman Salis

Gold is moving through a powerful long-term uptrend after breaking out of a consolidation phase that lasted from 2020 to 2024. The chart shows a clear structural shift, with price no longer capped by previous highs and instead advancing into a new cycle marked by expansion rather than range-bound behavior. Analyst Rashad Hajiyev has been tracking this development closely, noting that the current move represents a fundamental change in market character.
The Gold Breakout That Redefined Market Structure
The most important feature on the chart is the breakout above the 2020-2024 consolidation range. For several years, gold traded sideways, repeatedly failing to establish continuation beyond its upper boundary.
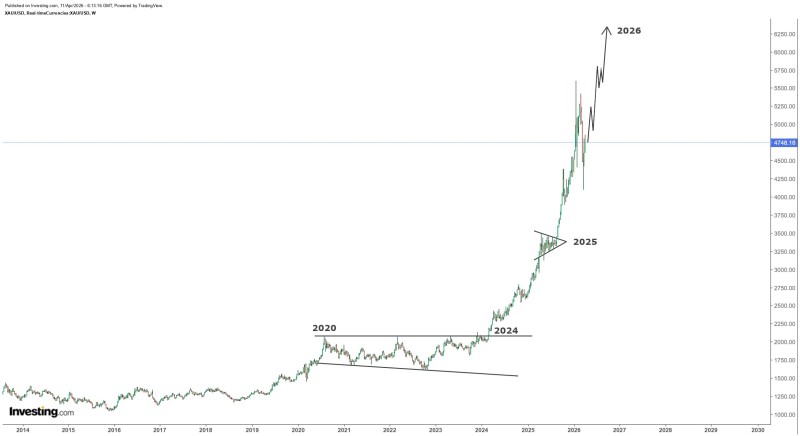
That changed in 2024, when price pushed above this range and began forming a series of higher highs and higher lows. This transition marks a shift from accumulation into a sustained trend, with the breakout level now acting as structural support rather than resistance.
The Gold Acceleration Phase Into 2025-2026
Following the breakout, the chart shows a clear acceleration in price through 2025 and into 2026. A brief consolidation structure appears during 2025, forming a tightening range before resolving higher - consistent with continuation patterns inside strong trends.
Levels once considered unrealistic are now part of the broader discussion, and the structure supports this change.
This behavior aligns with how trends typically evolve: expansion, consolidation, then continuation. Gold is currently in the continuation phase, with no visible breakdown or loss of structure on higher time frames. Gold Price Forecast: Eyes $7K-$8K After Channel Break highlights how sustained positioning near upper channel boundaries can precede further expansion.
Why the Long-Term Gold Narrative Is Shifting
The chart reflects a market that has already repriced significantly - from roughly $1,000 in earlier years to near $5,000 today - fundamentally changing how higher price targets are perceived.
Gold is no longer reacting to resistance in the same way it did during prior cycles. Analysis from Gold Price Prediction: XAU Breakout Could Target $7,000-$8,000 by May 2026 notes that continued bullish structure and consolidation near highs can lead to further upside extensions.
The key factors driving this structural shift include:
- Breakout above multi-year consolidation resistance now acting as support
- Series of higher highs and higher lows confirming trend direction
- Each consolidation phase resolving higher with no major support violations
- Price repricing from $1,000 to near $5,000, reshaping target perception
The Trend That Continues to Hold Above Key Levels
There are no signs on the chart of a structural breakdown. Price remains in a clear uptrend, with each consolidation resolving higher and no major violation of prior support zones.
As long as the structural foundation holds, the market continues to build toward higher levels.
This reinforces the idea that gold is not just moving higher - it is doing so within a defined advancing cycle. Similar patterns are also visible in Gold Price Analysis: Triangle Breakout Pattern Could Target $7,000 by Mid-May, where repeated consolidation breakouts within the trend have led to strong continuation moves.
Gold is no longer trading within a range - it is advancing within a cycle. The breakout from multi-year consolidation has reshaped the structure, and as long as that foundation holds, the market continues to build toward higher levels.
 Usman Salis


