 Marina Lyubimova

Gold continues to build momentum near critical resistance levels, sitting just below the upper boundary of a long-term ascending channel that has guided its rally since late 2025. After weeks of sideways movement around $5,179, XAU/USD is now positioned for what analysts believe could be a decisive breakout - one that might reshape the precious metal's trajectory through 2026 and beyond.
Gold Tests Multi-Month Channel Resistance at $5,179
Gold is approaching the upper boundary of its long-term ascending channel after consolidating near $5,179. As market analyst Rashad Hajiyev outlined, the current structure signals potential for a breakout that could push XAU/USD above prior resistance levels. Weekly charts show prices hovering in the mid-$5,000s while maintaining position above the rising lower trendline that has supported gold's advance.
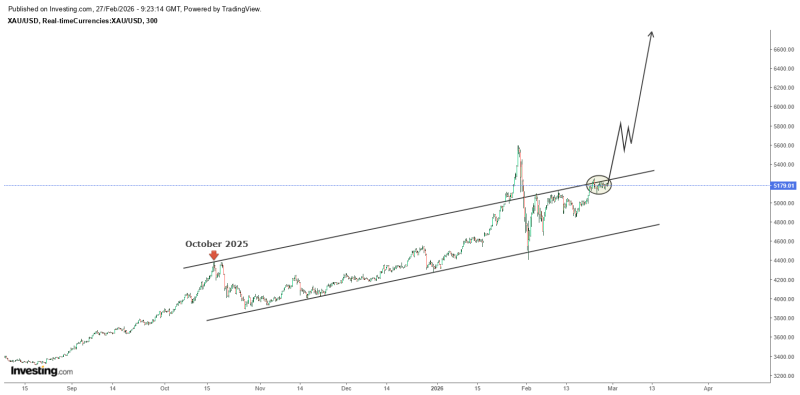
The technical setup reveals gold's climb has been well-contained within an upward sloping channel marked by consistent higher highs and higher lows. Price briefly spiked above the channel in February but has since settled near the breakout zone, now testing the next resistance band. "The breakout above the channel ceiling is central to our bullish projections," according to the analysis, with a retest of the all-time high serving as an intermediate milestone.
Breakout Patterns Point Toward Extended $7K-$8K Rally
Historical patterns show that when multi-year structures like this ascending channel resolve upward, extended moves typically follow. The recent pullback and stabilization suggest buyers remain active near the channel's upper boundary. If gold breaks decisively above resistance, follow-through momentum could accelerate and shift the broader trend dynamic from consolidation to expansion.
The potential channel breakout carries significance because it may signal a structural shift in gold's long-term trajectory. By holding above major support while compressing near resistance, XAU/USD has positioned itself for a directional move. How gold performs in this phase could influence sentiment across commodities and safe-haven markets, especially if the breakout generates momentum consistent with the $7,000-$8,000 target range projected for mid-2026.
Once above the current horizontal barrier, the next projected range implies substantial upside potential later in the year. Gold Price Forecast: Bullish Continuation Near $2,100 Resistance shows similar patterns where channel breakouts preceded major rallies. Technical indicators from Gold Price Analysis: $2,050 Holds as Key Support Zone confirm the strength of support structures. Meanwhile, Gold Price Outlook: Consolidation Near $2,000 Support demonstrates how consolidation phases often precede significant price moves.
 Marina Lyubimova


