Marina Lyubimova

Tesla is entering a high-tension stretch on the 1-hour chart, with price compressing after a fast recovery from the early-April low. As Paul noted, TSLA appears to be printing a triangle in wave 4 under the 700 million volume profile area, while the stochastic oscillator has rebounded from oversold and climbed to 80.4. With retail sentiment running much hotter than traditional positioning ahead of the April 22 print, the chart is starting to look less like a trend and more like a setup waiting for a trigger.
The TSLA Rebound That Changed the Tone
The chart shows Tesla recovering sharply from the early-April trough near the lower shaded demand zone, then accelerating into a steep impulse higher. That move reset the short-term structure and shifted the tape from persistent weakness to a pattern of higher lows.
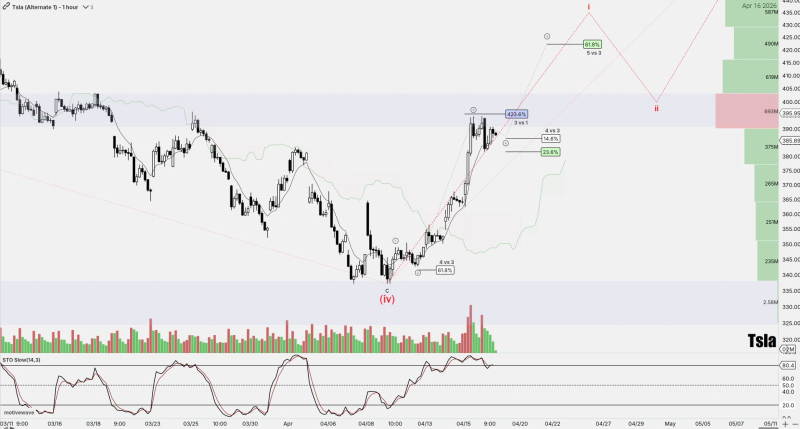
But the rally has now slowed beneath a heavier overhead area. Price pushed into the upper supply band around the low-$390s and then stopped advancing cleanly - the market is no longer moving in expansion mode but pausing at a spot where supply appears more active.
A TSLA Triangle Forms Under Overhead Supply
The current pattern is visibly tighter than the impulse leg that preceded it. Candles are compressing into a narrowing range just under resistance, which aligns with the triangle wave-4 interpretation.
Tesla is not breaking down - but it is also not reclaiming the upper zone with conviction. Instead, the stock is coiling below resistance around $395, while a lower support area near the mid-$380s remains the first level keeping the pattern intact.
Tesla Stock Breaks Out Above $423: Can the Rally Continue? shows what the structure looked like when TSLA was pressing into a higher resistance level, providing context for why the current compression below $395 represents a lower-stakes but structurally similar inflection point ahead of earnings.
TSLA Momentum Has Improved but Price Still Needs Confirmation
The stochastic reading is one of the more important details in the setup. The indicator bounced from oversold in early April and is now back above 80 - the recovery was not random, and momentum has genuinely pivoted higher.
But the chart also shows a familiar tension: momentum has already improved while price is still trapped beneath overhead supply. A clean push through the upper band would validate the improving momentum backdrop. Continued hesitation would keep the structure vulnerable to a sharper pullback inside the triangle.
TSLA Earnings Day Puts Tesla Stock at Critical $417 Support maps the key level that would come into focus if the triangle breaks to the downside rather than resolving higher - showing where earnings-related selling pressure would likely find its first meaningful test.
TSLA Sentiment Split Is Part of the Setup
The sentiment gap adds another layer to what the chart is showing. Retail is described as 75% bullish while traditional sentiment sits at 48% bullish. That divergence fits the current pattern well: optimism is strong enough to support the rebound, but not unified enough to deliver a clean breakout before earnings.
That is why the setup feels compressed rather than resolved. Tesla Eyes $500-$550 as Support Zone Holds After Fibonacci Pullback outlines the extended upside scenario if buyers regain control after the earnings catalyst - placing the current triangle compression within a much larger potential move that the April 22 print could either confirm or cancel.
Until then, TSLA remains pinned between rising short-term momentum and resistance that has not yet given way - exactly the kind of structure where earnings become the deciding variable rather than just another data point.
 Marina Lyubimova